
Page 8 - Peer Reviewed Laparoscopic Jornal
P. 8
Swapan Kumar Maiti et al
Biochemical Observations in all of the animals of three groups started to increase at
Mean ± SE values of AST and ALT in the animals of three 30 minutes after CP and reached to peak at 120 minutes
groups are presented in Figures 6 and 7 respectively. AST after CP, which were significantly (p < 0.01) higher than
and ALT values were within the normal range in all of the the base value of the respective group.
animals of three different groups throughout the observation DISCUSSION
period. Comparison among three groups revealed no
significant (p > 0.05) changes at any time interval. Mean ± General anesthesia was achieved by inducing xylazine and
SE values of creatinine, blood urea nitrogen and uric acid in ketamine combination with premedication by atropine
animals of three groups are presented in Table 10. The sulphate was found sufficient to establish CP and
creatinine, BUN and uric acid values in all three groups were laparoscopy in the animals of three different groups.
within the normal range throughout the observation period. Induction as well as recovery from general anesthesia was
smooth and uneventful in all of the animals, as was also
Hormonal Estimation reported by Wildt and associates in 1977. 1
Mean ± SE of cortisol values recorded in animals of three The establishment of CP in the animals of all three
different groups are presented in Figure 8. Cortisol values groups was easy through Verees needle at preselected
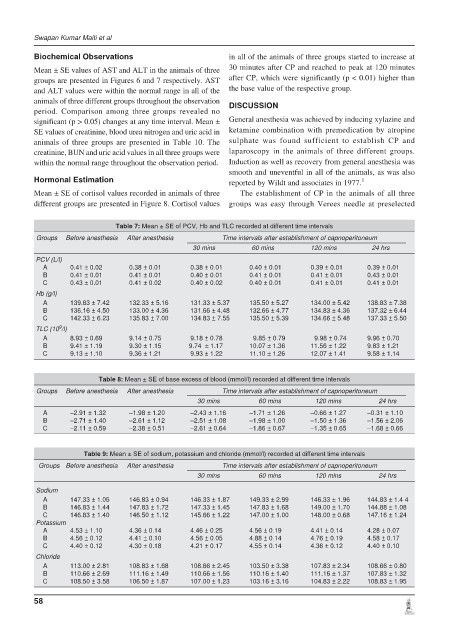
Table 7: Mean ± SE of PCV, Hb and TLC recorded at different time intervals
Groups Before anesthesia After anesthesia Time intervals after establishment of capnoperitoneum
30 mins 60 mins 120 mins 24 hrs
PCV (L/l)
A 0.41 ± 0.02 0.38 ± 0.01 0.38 ± 0.01 0.40 ± 0.01 0.39 ± 0.01 0.39 ± 0.01
B 0.41 ± 0.01 0.41 ± 0.01 0.40 ± 0.01 0.41 ± 0.01 0.41 ± 0.01 0.43 ± 0.01
C 0.43 ± 0.01 0.41 ± 0.02 0.40 ± 0.02 0.40 ± 0.01 0.41 ± 0.01 0.41 ± 0.01
Hb (g/l)
A 139.83 ± 7.42 132.33 ± 5.16 131.33 ± 5.37 135.50 ± 5.27 134.00 ± 5.42 138.83 ± 7.38
B 136.16 ± 4.50 133.00 ± 4.36 131.66 ± 4.48 132.66 ± 4.77 134.83 ± 4.36 137.32 ± 6.44
C 142.33 ± 6.23 135.83 ± 7.00 134.83 ± 7.55 135.50 ± 5.39 134.66 ± 5.48 137.33 ± 5.50
9
TLC (10 /l)
A 8.93 ± 0.69 9.14 ± 0.75 9.18 ± 0.78 9.85 ± 0.79 9.98 ± 0.74 9.96 ± 0.70
B 9.41 ± 1.19 9.30 ± 1.15 9.74 ± 1.17 10.07 ± 1.36 11.56 ± 1.22 9.83 ± 1.21
C 9.13 ± 1.10 9.36 ± 1.21 9.93 ± 1.22 11.10 ± 1.26 12.07 ± 1.41 9.58 ± 1.14
Table 8: Mean ± SE of base excess of blood (mmol/l) recorded at different time intervals
Groups Before anesthesia After anesthesia Time intervals after establishment of capnoperitoneum
30 mins 60 mins 120 mins 24 hrs
A –2.91 ± 1.32 –1.98 ± 1.20 –2.43 ± 1.16 –1.71 ± 1.26 –0.66 ± 1.27 –0.31 ± 1.10
B –2.71 ± 1.40 –2.61 ± 1.12 –2.51 ± 1.08 –1.98 ± 1.00 –1.50 ± 1.36 –1.56 ± 2.06
C –2.11 ± 0.59 –2.38 ± 0.51 –2.61 ± 0.64 –1.86 ± 0.67 –1.35 ± 0.65 –1.68 ± 0.66
Table 9: Mean ± SE of sodium, potassium and chloride (mmol/l) recorded at different time intervals
Groups Before anesthesia After anesthesia Time intervals after establishment of capnoperitoneum
30 mins 60 mins 120 mins 24 hrs
Sodium
A 147.33 ± 1.05 146.83 ± 0.94 146.33 ± 1.87 149.33 ± 2.99 146.33 ± 1.96 144.83 ± 1.4 4
B 146.83 ± 1.44 147.83 ± 1.72 147.33 ± 1.45 147.83 ± 1.68 149.00 ± 1.70 144.88 ± 1.08
C 146.83 ± 1.40 146.50 ± 1.12 145.66 ± 1.22 147.00 ± 1.00 148.00 ± 0.68 147.16 ± 1.24
Potassium
A 4.53 ± 1.10 4.36 ± 0.14 4.46 ± 0.25 4.56 ± 0.19 4.41 ± 0.14 4.28 ± 0.07
B 4.56 ± 0.12 4.41 ± 0.10 4.56 ± 0.05 4.88 ± 0.14 4.76 ± 0.19 4.58 ± 0.17
C 4.40 ± 0.12 4.30 ± 0.18 4.21 ± 0.17 4.55 ± 0.14 4.36 ± 0.12 4.40 ± 0.10
Chloride
A 113.00 ± 2.81 108.83 ± 1.68 108.66 ± 2.45 103.50 ± 3.38 107.83 ± 2.34 108.66 ± 0.80
B 110.66 ± 2.69 111.16 ± 1.49 110.66 ± 1.56 110.16 ± 1.40 111.16 ± 1.37 107.83 ± 1.32
C 108.50 ± 3.58 106.50 ± 1.87 107.00 ± 1.23 103.16 ± 3.16 104.83 ± 2.22 108.83 ± 1.95
58