
Page 6 - Peer Reviewed Laparoscopic Jornal
P. 6
Swapan Kumar Maiti et al
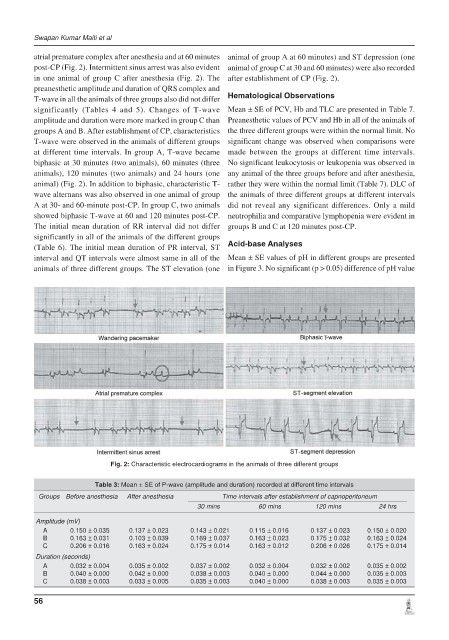
atrial premature complex after anesthesia and at 60 minutes animal of group A at 60 minutes) and ST depression (one
post-CP (Fig. 2). Intermittent sinus arrest was also evident animal of group C at 30 and 60 minutes) were also recorded
in one animal of group C after anesthesia (Fig. 2). The after establishment of CP (Fig. 2).
preanesthetic amplitude and duration of QRS complex and
T-wave in all the animals of three groups also did not differ Hematological Observations
significantly (Tables 4 and 5). Changes of T-wave Mean ± SE of PCV, Hb and TLC are presented in Table 7.
amplitude and duration were more marked in group C than Preanesthetic values of PCV and Hb in all of the animals of
groups A and B. After establishment of CP, characteristics the three different groups were within the normal limit. No
T-wave were observed in the animals of different groups significant change was observed when comparisons were
at different time intervals. In group A, T-wave became made between the groups at different time intervals.
biphasic at 30 minutes (two animals), 60 minutes (three No significant leukocytosis or leukopenia was observed in
animals), 120 minutes (two animals) and 24 hours (one any animal of the three groups before and after anesthesia,
animal) (Fig. 2). In addition to biphasic, characteristic T- rather they were within the normal limit (Table 7). DLC of
wave alternans was also observed in one animal of group the animals of three different groups at different intervals
A at 30- and 60-minute post-CP. In group C, two animals did not reveal any significant differences. Only a mild
showed biphasic T-wave at 60 and 120 minutes post-CP. neutrophilia and comparative lymphopenia were evident in
The initial mean duration of RR interval did not differ groups B and C at 120 minutes post-CP.
significantly in all of the animals of the different groups
(Table 6). The initial mean duration of PR interval, ST Acid-base Analyses
interval and QT intervals were almost same in all of the Mean ± SE values of pH in different groups are presented
animals of three different groups. The ST elevation (one in Figure 3. No significant (p > 0.05) difference of pH value
Fig. 2: Characteristic electrocardiograms in the animals of three different groups
Table 3: Mean ± SE of P-wave (amplitude and duration) recorded at different time intervals
Groups Before anesthesia After anesthesia Time intervals after establishment of capnoperitoneum
30 mins 60 mins 120 mins 24 hrs
Amplitude (mV)
A 0.150 ± 0.035 0.137 ± 0.023 0.143 ± 0.021 0.115 ± 0.016 0.137 ± 0.023 0.150 ± 0.020
B 0.163 ± 0.031 0.103 ± 0.039 0.169 ± 0.037 0.163 ± 0.023 0.175 ± 0.032 0.163 ± 0.024
C 0.206 ± 0.016 0.163 ± 0.024 0.175 ± 0.014 0.163 ± 0.012 0.206 ± 0.026 0.175 ± 0.014
Duration (seconds)
A 0.032 ± 0.004 0.035 ± 0.002 0.037 ± 0.002 0.032 ± 0.004 0.032 ± 0.002 0.035 ± 0.002
B 0.040 ± 0.000 0.042 ± 0.000 0.038 ± 0.003 0.040 ± 0.000 0.044 ± 0.000 0.035 ± 0.003
C 0.038 ± 0.003 0.033 ± 0.005 0.035 ± 0.003 0.040 ± 0.000 0.038 ± 0.003 0.035 ± 0.003
56