
Page 5 - Peer Reviewed Laparoscopic Jornal
P. 5
WJOLS
Effect of Different Carbon Dioxide Pressure Gradients in Capnoperitoneum for Laparoscopic Examination in Dogs
significantly (p < 0.05) increased at 60 minutes interval after in all three groups remained within the normal limits
CP. Heart rate (beats/min) decreased nonsignificantly throughout the observation period.
(p > 0.05) immediately after anesthesia and at 30, 60 and
120 minutes after CP in all of the animals of the three groups. Electrocardiographic Indices
However, it again nonsignificantly (p > 0.05) increased at The mean amplitude and duration of P-wave in all the
24 hours postlaparoscopy in all the three groups. This animals of three groups did not differ significantly
fluctuation in heart rate was more pronounced in the animals (Table 3). Wandering pacemaker was evident in three
of group C than it was in groups A and B. Preoperative as animals of groups A and B and one animal of group C
well as postoperative mean rectal temperatures (°F) recorded after CP (Fig. 2). One animal of group C showed occasional
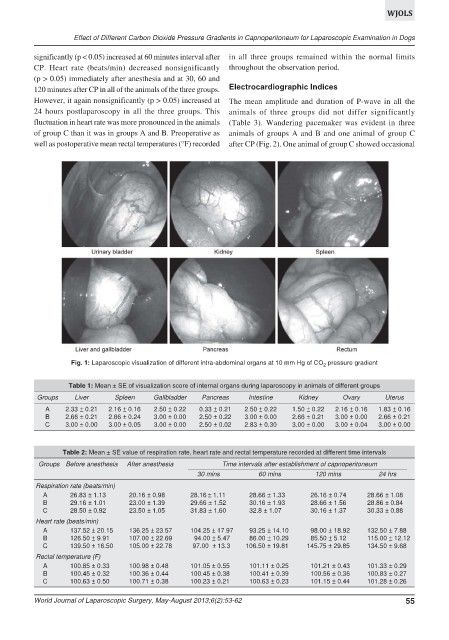
Fig. 1: Laparoscopic visualization of different intra-abdominal organs at 10 mm Hg of CO pressure gradient
2
Table 1: Mean ± SE of visualization score of internal organs during laparoscopy in animals of different groups
Groups Liver Spleen Gallbladder Pancreas Intestine Kidney Ovary Uterus
A 2.33 ± 0.21 2.16 ± 0.16 2.50 ± 0.22 0.33 ± 0.21 2.50 ± 0.22 1.50 ± 0.22 2.16 ± 0.16 1.83 ± 0.16
B 2.66 ± 0.21 2.66 ± 0.24 3.00 ± 0.00 2.50 ± 0.22 3.00 ± 0.00 2.66 ± 0.21 3.00 ± 0.00 2.66 ± 0.21
C 3.00 ± 0.00 3.00 ± 0.05 3.00 ± 0.00 2.50 ± 0.02 2.83 ± 0.30 3.00 ± 0.00 3.00 ± 0.04 3.00 ± 0.00
Table 2: Mean ± SE value of respiration rate, heart rate and rectal temperature recorded at different time intervals
Groups Before anesthesia After anesthesia Time intervals after establishment of capnoperitoneum
30 mins 60 mins 120 mins 24 hrs
Respiration rate (beats/min)
A 26.83 ± 1.13 20.16 ± 0.98 28.16 ± 1.11 28.66 ± 1.33 26.16 ± 0.74 28.66 ± 1.08
B 29.16 ± 1.01 23.00 ± 1.39 29.66 ± 1.52 30.16 ± 1.93 28.66 ± 1.56 28.86 ± 0.84
C 28.50 ± 0.92 23.50 ± 1.05 31.83 ± 1.60 32.8 ± 1.07 30.16 ± 1.37 30.33 ± 0.88
Heart rate (beats/min)
A 137.52 ± 20.15 136.25 ± 23.57 104.25 ± 17.97 93.25 ± 14.10 98.00 ± 18.92 132.50 ± 7.88
B 126.50 ± 9.91 107.00 ± 22.69 94.00 ± 5.47 86.00 ± 10.29 85.50 ± 5.12 115.00 ± 12.12
C 139.50 ± 16.50 105.00 ± 22.78 97.00 ± 13.3 106.50 ± 19.81 145.75 ± 29.85 134.50 ± 9.68
Rectal temperature (F)
A 100.85 ± 0.33 100.98 ± 0.48 101.05 ± 0.55 101.11 ± 0.25 101.21 ± 0.43 101.33 ± 0.29
B 100.45 ± 0.32 100.36 ± 0.44 100.45 ± 0.38 100.41 ± 0.39 100.56 ± 0.36 100.83 ± 0.27
C 100.63 ± 0.50 100.71 ± 0.38 100.23 ± 0.21 100.63 ± 0.23 101.15 ± 0.44 101.28 ± 0.26
World Journal of Laparoscopic Surgery, May-August 2013;6(2):53-62 55