
Page 82 - World Journal of Laparoscopic Surgery
P. 82
LSG in Obesity and GERD
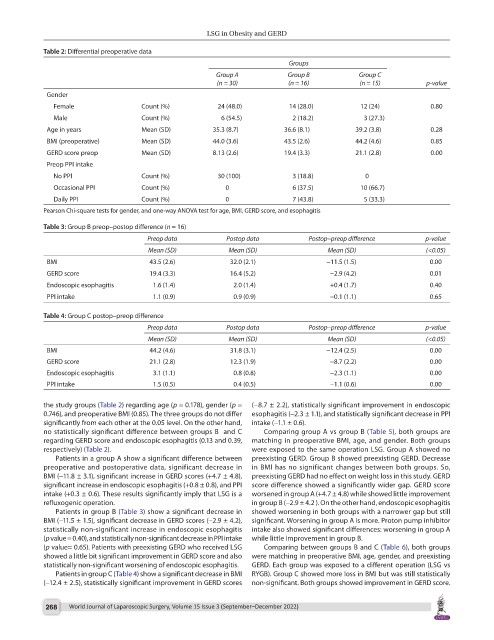
Table 2: Differential preoperative data
Groups
Group A Group B Group C
(n = 30) (n = 16) (n = 15) p-value
Gender
Female Count (%) 24 (48.0) 14 (28.0) 12 (24) 0.80
Male Count (%) 6 (54.5) 2 (18.2) 3 (27.3)
Age in years Mean (SD) 35.3 (8.7) 36.6 (8.1) 39.2 (3.8) 0.28
BMI (preoperative) Mean (SD) 44.0 (3.6) 43.5 (2.6) 44.2 (4.6) 0.85
GERD score preop Mean (SD) 8.13 (2.6) 19.4 (3.3) 21.1 (2.8) 0.00
Preop PPI intake
No PPI Count (%) 30 (100) 3 (18.8) 0
Occasional PPI Count (%) 0 6 (37.5) 10 (66.7)
Daily PPI Count (%) 0 7 (43.8) 5 (33.3)
Pearson Chi-square tests for gender, and one-way ANOVA test for age, BMI, GERD score, and esophagitis
Table 3: Group B preop–postop difference (n = 16)
Preop data Postop data Postop–preop difference p-value
Mean (SD) Mean (SD) Mean (SD) (<0.05)
BMI 43.5 (2.6) 32.0 (2.1) −11.5 (1.5) 0.00
GERD score 19.4 (3.3) 16.4 (5.2) −2.9 (4.2) 0.01
Endoscopic esophagitis 1.6 (1.4) 2.0 (1.4) +0.4 (1.7) 0.40
PPI intake 1.1 (0.9) 0.9 (0.9) −0.1 (1.1) 0.65
Table 4: Group C postop–preop difference
Preop data Postop data Postop–preop difference p-value
Mean (SD) Mean (SD) Mean (SD) (<0.05)
BMI 44.2 (4.6) 31.8 (3.1) −12.4 (2.5) 0.00
GERD score 21.1 (2.8) 12.3 (1.9) −8.7 (2.2) 0.00
Endoscopic esophagitis 3.1 (1.1) 0.8 (0.8) −2.3 (1.1) 0.00
PPI intake 1.5 (0.5) 0.4 (0.5) −1.1 (0.6) 0.00
the study groups (Table 2) regarding age (p = 0.178), gender (p = (−8.7 ± 2.2), statistically significant improvement in endoscopic
0.746), and preoperative BMI (0.85). The three groups do not differ esophagitis (−2.3 ± 1.1), and statistically significant decrease in PPI
significantly from each other at the 0.05 level. On the other hand, intake (−1.1 ± 0.6).
no statistically significant difference between groups B and C Comparing group A vs group B (Table 5), both groups are
regarding GERD score and endoscopic esophagitis (0.13 and 0.39, matching in preoperative BMI, age, and gender. Both groups
respectively) (Table 2). were exposed to the same operation LSG. Group A showed no
Patients in a group A show a significant difference between preexisting GERD. Group B showed preexisting GERD. Decrease
preoperative and postoperative data, significant decrease in in BMI has no significant changes between both groups. So,
BMI (−11.8 ± 3.1), significant increase in GERD scores (+4.7 ± 4.8), preexisting GERD had no effect on weight loss in this study. GERD
significant increase in endoscopic esophagitis (+0.8 ± 0.8), and PPI score difference showed a significantly wider gap. GERD score
intake (+0.3 ± 0.6). These results significantly imply that LSG is a worsened in group A (+4.7 ± 4.8) while showed little improvement
refluxogenic operation. in group B (−2.9 ± 4.2 ). On the other hand, endoscopic esophagitis
Patients in group B (Table 3) show a significant decrease in showed worsening in both groups with a narrower gap but still
BMI (−11.5 ± 1.5), significant decrease in GERD scores (−2.9 ± 4.2), significant. Worsening in group A is more. Proton pump inhibitor
statistically non-significant increase in endoscopic esophagitis intake also showed significant differences: worsening in group A
(p value = 0.40), and statistically non-significant decrease in PPI intake while little improvement in group B.
(p value= 0.65). Patients with preexisting GERD who received LSG Comparing between groups B and C (Table 6), both groups
showed a little bit significant improvement in GERD score and also were matching in preoperative BMI, age, gender, and preexisting
statistically non-significant worsening of endoscopic esophagitis. GERD. Each group was exposed to a different operation (LSG vs
Patients in group C (Table 4) show a significant decrease in BMI RYGB). Group C showed more loss in BMI but was still statistically
(−12.4 ± 2.5), statistically significant improvement in GERD scores non-significant. Both groups showed improvement in GERD score.
268 World Journal of Laparoscopic Surgery, Volume 15 Issue 3 (September–December 2022)