
Page 83 - World Journal of Laparoscopic Surgery
P. 83
LSG in Obesity and GERD
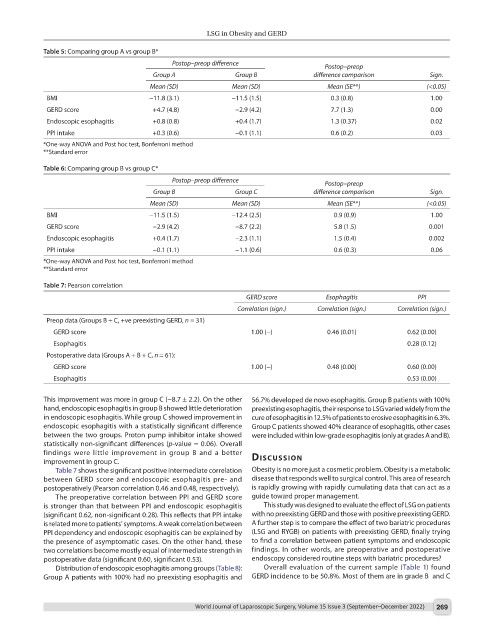
Table 5: Comparing group A vs group B*
Postop–preop difference Postop–preop
Group A Group B difference comparison Sign.
Mean (SD) Mean (SD) Mean (SE**) (<0.05)
BMI −11.8 (3.1) −11.5 (1.5) 0.3 (0.8) 1.00
GERD score +4.7 (4.8) −2.9 (4.2) 7.7 (1.3) 0.00
Endoscopic esophagitis +0.8 (0.8) +0.4 (1.7) 1.3 (0.37) 0.02
PPI intake +0.3 (0.6) −0.1 (1.1) 0.6 (0.2) 0.03
*One-way ANOVA and Post hoc test, Bonferroni method
**Standard error
Table 6: Comparing group B vs group C*
Postop–preop difference Postop–preop
Group B Group C difference comparison Sign.
Mean (SD) Mean (SD) Mean (SE**) (<0.05)
BMI −11.5 (1.5) −12.4 (2.5) 0.9 (0.9) 1.00
GERD score −2.9 (4.2) −8.7 (2.2) 5.8 (1.5) 0.001
Endoscopic esophagitis +0.4 (1.7) −2.3 (1.1) 1.5 (0.4) 0.002
PPI intake −0.1 (1.1) −1.1 (0.6) 0.6 (0.3) 0.06
*One-way ANOVA and Post hoc test, Bonferroni method
**Standard error
Table 7: Pearson correlation
GERD score Esophagitis PPI
Correlation (sign.) Correlation (sign.) Correlation (sign.)
Preop data (Groups B + C, +ve preexisting GERD, n = 31)
GERD score 1.00 (−) 0.46 (0.01) 0.62 (0.00)
Esophagitis 0.28 (0.12)
Postoperative data (Groups A + B + C, n = 61):
GERD score 1.00 (−) 0.48 (0.00) 0.60 (0.00)
Esophagitis 0.53 (0.00)
This improvement was more in group C (−8.7 ± 2.2). On the other 56.7% developed de novo esophagitis. Group B patients with 100%
hand, endoscopic esophagitis in group B showed little deterioration preexisting esophagitis, their response to LSG varied widely from the
in endoscopic esophagitis. While group C showed improvement in cure of esophagitis in 12.5% of patients to erosive esophagitis in 6.3%.
endoscopic esophagitis with a statistically significant difference Group C patients showed 40% clearance of esophagitis, other cases
between the two groups. Proton pump inhibitor intake showed were included within low-grade esophagitis (only at grades A and B).
statistically non-significant differences (p-value = 0.06). Overall
findings were little improvement in group B and a better
improvement in group C. dIscussIon
Table 7 shows the significant positive intermediate correlation Obesity is no more just a cosmetic problem. Obesity is a metabolic
between GERD score and endoscopic esophagitis pre- and disease that responds well to surgical control. This area of research
postoperatively (Pearson correlation 0.46 and 0.48, respectively). is rapidly growing with rapidly cumulating data that can act as a
The preoperative correlation between PPI and GERD score guide toward proper management.
is stronger than that between PPI and endoscopic esophagitis This study was designed to evaluate the effect of LSG on patients
(significant 0.62, non-significant 0.28). This reflects that PPI intake with no preexisting GERD and those with positive preexisting GERD.
is related more to patients’ symptoms. A weak correlation between A further step is to compare the effect of two bariatric procedures
PPI dependency and endoscopic esophagitis can be explained by (LSG and RYGB) on patients with preexisting GERD, finally trying
the presence of asymptomatic cases. On the other hand, these to find a correlation between patient symptoms and endoscopic
two correlations become mostly equal of intermediate strength in findings. In other words, are preoperative and postoperative
postoperative data (significant 0.60, significant 0.53). endoscopy considered routine steps with bariatric procedures?
Distribution of endoscopic esophagitis among groups (Table 8): Overall evaluation of the current sample (Table 1) found
Group A patients with 100% had no preexisting esophagitis and GERD incidence to be 50.8%. Most of them are in grade B and C
World Journal of Laparoscopic Surgery, Volume 15 Issue 3 (September–December 2022) 269