
Page 81 - World Journal of Laparoscopic Surgery
P. 81
LSG in Obesity and GERD
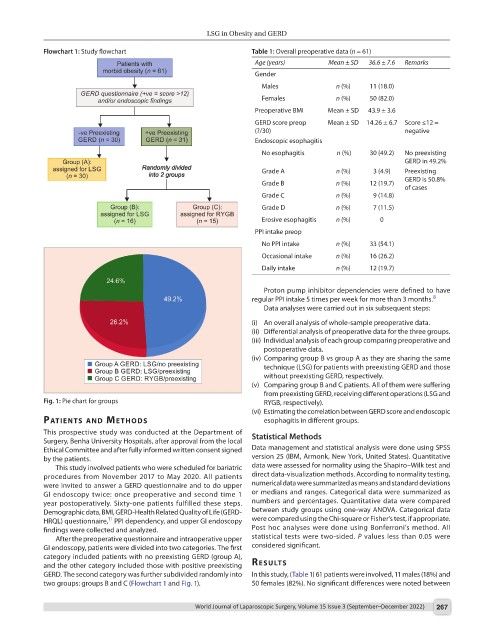
Flowchart 1: Study flowchart Table 1: Overall preoperative data (n = 61)
Age (years) Mean ± SD 36.6 ± 7.6 Remarks
Gender
Males n (%) 11 (18.0)
Females n (%) 50 (82.0)
Preoperative BMI Mean ± SD 43.9 ± 3.6
GERD score preop Mean ± SD 14.26 ± 6.7 Score ≤12 =
(?/30) negative
Endoscopic esophagitis
No esophagitis n (%) 30 (49.2) No preexisting
GERD in 49.2%
Grade A n (%) 3 (4.9) Preexisting
Grade B n (%) 12 (19.7) GERD is 50.8%
of cases
Grade C n (%) 9 (14.8)
Grade D n (%) 7 (11.5)
Erosive esophagitis n (%) 0
PPI intake preop
No PPI intake n (%) 33 (54.1)
Occasional intake n (%) 16 (26.2)
Daily intake n (%) 12 (19.7)
Proton pump inhibitor dependencies were defined to have
regular PPI intake 5 times per week for more than 3 months. 8
Data analyses were carried out in six subsequent steps:
(i) An overall analysis of whole-sample preoperative data.
(ii) Differential analysis of preoperative data for the three groups.
(iii) Individual analysis of each group comparing preoperative and
postoperative data.
(iv) Comparing group B vs group A as they are sharing the same
technique (LSG) for patients with preexisting GERD and those
without preexisting GERD, respectively.
(v) Comparing group B and C patients. All of them were suffering
from preexisting GERD, receiving different operations (LSG and
Fig. 1: Pie chart for groups RYGB, respectively).
(vi) Estimating the correlation between GERD score and endoscopic
PAtIents And Methods esophagitis in different groups.
This prospective study was conducted at the Department of
Surgery, Benha University Hospitals, after approval from the local Statistical Methods
Ethical Committee and after fully informed written consent signed Data management and statistical analysis were done using SPSS
by the patients. version 25 (IBM, Armonk, New York, United States). Quantitative
This study involved patients who were scheduled for bariatric data were assessed for normality using the Shapiro–Wilk test and
procedures from November 2017 to May 2020. All patients direct data-visualization methods. According to normality testing,
were invited to answer a GERD questionnaire and to do upper numerical data were summarized as means and standard deviations
GI endoscopy twice: once preoperative and second time 1 or medians and ranges. Categorical data were summarized as
year postoperatively. Sixty-one patients fulfilled these steps. numbers and percentages. Quantitative data were compared
Demographic data, BMI, GERD-Health Related Quality of Life (GERD- between study groups using one-way ANOVA. Categorical data
11
HRQL) questionnaire, PPI dependency, and upper GI endoscopy were compared using the Chi-square or Fisher’s test, if appropriate.
findings were collected and analyzed. Post hoc analyses were done using Bonferroni’s method. All
After the preoperative questionnaire and intraoperative upper statistical tests were two-sided. P values less than 0.05 were
GI endoscopy, patients were divided into two categories. The first considered significant.
category included patients with no preexisting GERD (group A),
and the other category included those with positive preexisting results
GERD. The second category was further subdivided randomly into In this study, (Table 1) 61 patients were involved, 11 males (18%) and
two groups: groups B and C (Flowchart 1 and Fig. 1). 50 females (82%). No significant differences were noted between
World Journal of Laparoscopic Surgery, Volume 15 Issue 3 (September–December 2022) 267