
Page 17 - World Journal of Laparoscopic Surgery
P. 17
Study of Selection of Method of Laparoscopic Inguinal Hernia Repair
Table 1A: Age distribution Table 3: Duration of surgery
Age range (years) Number of patients Surgery done N Mean (average) (minutes)
13–20 3 Laparoscopic hernia repair 100 90
21–30 5 TEP 50 80
31–40 10 TAPP 50 100
41–50 10
51–60 15 Table 4: Incidence of pain at 1 week
61–70 7 LAP hernia repair (both TEP and TAPP)
50
Grade of pain Total Percentage
P0 (No pain) 74 74
Table 1B: Mean age distribution
P1 (Mild) 26 26
N Minimum Maximum Mean
P2 (Moderate) 0 0
Age (year) 100 16 68 45.40
P3 (Severe) 0 0
Table 2: Type of surgeries in different types of hernias
Table 5: Incidence of pain at 3 months
Type of hernia Total
Direct 58 LAP hernia repair (both TEP and TAPP)
Indirect 42 Grade of pain Total Percentage
Laparoscopic TEP 50 P0 (No pain) 98 98
Laparoscopic TAPP 50 P1 (Mild) 2 (in TAPP only) 2
P2 (Moderate) 0 0
• Patients who were not willing to follow-up. P3 (Severe) 0 0
• History of any previous pelvic surgery or irradiation for
malignancy. Table 6: Seroma formation
• Recurrent laparoscopic hernia.
LAP hernia repair Seroma formation
Visual analog scale (VAS) was used to assess the severity of pain. The TEP 1
patient was asked to describe the pain on a scale of 0–10; 0 denoted
“no pain,” 1 denoted “mild pain,” and 10 denoted “worst pain.” TAPP 3
Pain Score
• P0, VAS score 0: No pain Table 7: Wound infection
• P1, VAS score 1–3: Mild LAP hernia repair Wound infection (%)
• P2, VAS score 4–6: Moderate TAPP 2
• P3: VAS score 7–10: Severe TEP 0
results
In this study of laparoscopic inguinal hernia repair, 100 cases were Table 8: Surgical emphysema
taken for study from 2019 to 2021. Operative and postoperative LAP hernia repair Surgical emphysema (out of 50)
details were collected and confirmed by asking questions and TEP 12 (24%)
systemic examination was done during the follow-up. The follow-up TAPP 0 (0%)
duration was 1 year.
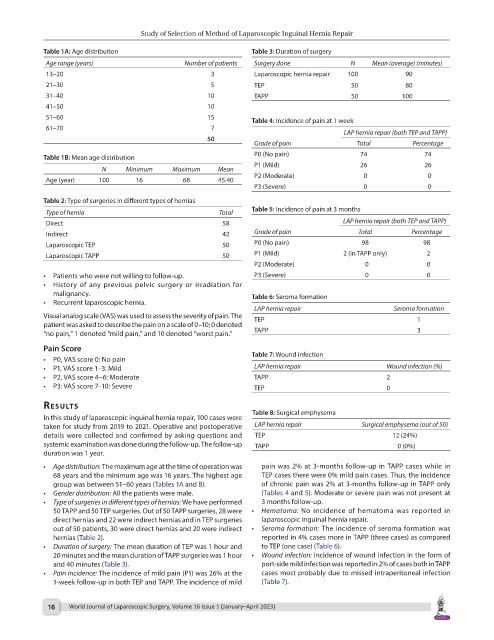
• Age distribution: The maximum age at the time of operation was pain was 2% at 3-months follow-up in TAPP cases while in
68 years and the minimum age was 16 years. The highest age TEP cases there were 0% mild pain cases. Thus, the incidence
group was between 51–60 years (Tables 1A and B). of chronic pain was 2% at 3-months follow-up in TAPP only
• Gender distribution: All the patients were male. (Tables 4 and 5). Moderate or severe pain was not present at
• Type of surgeries in different types of hernias: We have performed 3 months follow-up.
50 TAPP and 50 TEP surgeries. Out of 50 TAPP surgeries, 28 were • Hematoma: No incidence of hematoma was reported in
direct hernias and 22 were indirect hernias and in TEP surgeries laparoscopic inguinal hernia repair.
out of 50 patients, 30 were direct hernias and 20 were indirect • Seroma formation: The incidence of seroma formation was
hernias (Table 2). reported in 4% cases more in TAPP (three cases) as compared
• Duration of surgery: The mean duration of TEP was 1 hour and to TEP (one case) (Table 6).
20 minutes and the mean duration of TAPP surgeries was 1 hour • Wound infection: Incidence of wound infection in the form of
and 40 minutes (Table 3). port-side mild infection was reported in 2% of cases both in TAPP
• Pain incidence: The incidence of mild pain (P1) was 26% at the cases most probably due to missed intraperitoneal infection
1-week follow-up in both TEP and TAPP. The incidence of mild (Table 7).
16 World Journal of Laparoscopic Surgery, Volume 16 Issue 1 (January–April 2023)