
Page 16 - WJOLS
P. 16
Mingliang Wang et al
RESULTS TABLE 2: Durations of operation and postoperative
hospital stay (Mean ± SD)
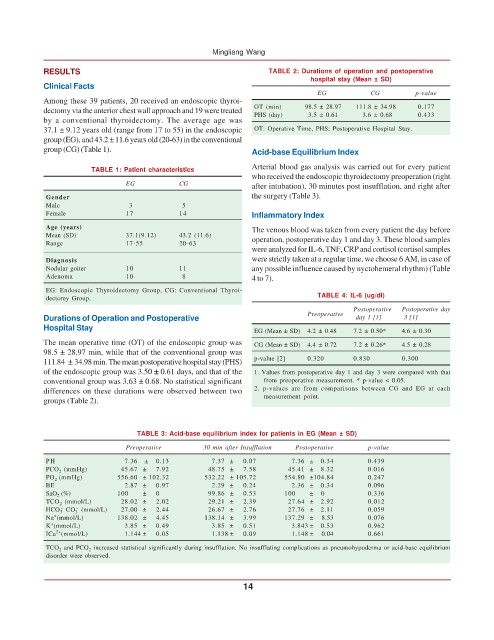
Clinical Facts
EG CG p-value
Among these 39 patients, 20 received an endoscopic thyroi-
dectomy via the anterior chest wall approach and 19 were treated OT (min) 98.5 ± 28.97 111.8 ± 34.98 0.177
by a conventional thyroidectomy. The average age was PHS (day) 3.5 ± 0.61 3.6 ± 0.68 0.433
37.1 ± 9.12 years old (range from 17 to 55) in the endoscopic OT: Operative Time, PHS: Postoperative Hospital Stay.
group (EG), and 43.2 ± 11.6 years old (20-63) in the conventional
group (CG) (Table 1). Acid-base Equilibrium Index
TABLE 1: Patient characteristics Arterial blood gas analysis was carried out for every patient
who received the endoscopic thyroidectomy preoperation (right
EG CG after intubation), 30 minutes post insufflation, and right after
Gender the surgery (Table 3).
Male 3 5
Female 17 14 Inflammatory Index
Age (years) The venous blood was taken from every patient the day before
Mean (SD) 37.1(9.12) 43.2 (11.6) operation, postoperative day 1 and day 3. These blood samples
Range 17-55 20-63
were analyzed for IL-6, TNF, CRP and cortisol (cortisol samples
Diagnosis were strictly taken at a regular time, we choose 6 AM, in case of
Nodular goiter 10 11 any possible influence caused by nyctohemeral rhythm) (Table
Adenoma 10 8 4 to 7).
EG: Endoscopic Thyroidectomy Group, CG: Conventional Thyroi-
dectomy Group. TABLE 4: IL-6 (ug/dl)
Postoperative Postoperative day
Preoperative
Durations of Operation and Postoperative day 1 [1] 3 [1]
Hospital Stay EG (Mean ± SD) 4.2 ± 0.48 7.2 ± 0.50* 4.6 ± 0.30
The mean operative time (OT) of the endoscopic group was CG (Mean ± SD) 4.4 ± 0.72 7.2 ± 0.26* 4.5 ± 0.28
98.5 ± 28.97 min, while that of the conventional group was
111.84 ± 34.98 min. The mean postoperative hospital stay (PHS) p-value [2] 0.320 0.830 0.300
of the endoscopic group was 3.50 ± 0.61 days, and that of the 1. Values from postoperative day 1 and day 3 were compared with that
conventional group was 3.63 ± 0.68. No statistical significant from preoperative measurement. * p-value < 0.05.
differences on these durations were observed between two 2. p-values are from comparisons between CG and EG at each
groups (Table 2). measurement point.
TABLE 3: Acid-base equilibrium index for patients in EG (Mean ± SD)
Preoperative 30 min after Insufflation Postoperative p-value
PH 7.36 ± 0.13 7.37 ± 0.07 7.36 ± 0.34 0.439
PCO 2 (mmHg) 45.67 ± 7.92 48.75 ± 7.58 45.41 ± 8.32 0.016
PO 2 (mmHg) 556.60 ± 102.32 532.22 ± 105.72 554.80 ±104.84 0.247
BE 2.87 ± 0.97 2.29 ± 0.24 2.36 ± 0.34 0.096
SaO 2 (%) 100 ± 0 99.86 ± 0.53 100 ± 0 0.336
TCO 2 (mmol/L) 28.02 ± 2.02 29.21 ± 2.39 27.64 ± 2.92 0.012
–
–
HCO CO (mmol/L) 27.00 ± 2.44 26.67 ± 2.76 27.76 ± 2.11 0.059
3
2
+
Na (mmol/L) 138.02 ± 4.45 138.14 ± 3.99 137.29 ± 8.53 0.076
+
K (mmol/L) 3.85 ± 0.49 3.85 ± 0.51 3.843 ± 0.53 0.962
2+
ICa (mmol/L) 1.144 ± 0.05 1.138 ± 0.09 1.148 ± 0.04 0.661
TCO 2 and PCO 2 increased statistical significantly during insufflation. No insufflating complications as pneumohypoderma or acid-base equilibrium
disorder were observed.
14