
Page 19 - World Journal of Laparoscopic Surgery
P. 19
WJOLS
Laparoscopic-assisted Vaginal Hysterectomy vs Hand-assisted Laparoscopic Hysterectomy
Table 4: Estimated blood loss (mL), blood transfusion (packed
RBC units), IV fluids (mL), and Hb reduction (gm/dL)
Group 1: Group 2:
Items LAVH HALH p-value
Number 21 20
Mean blood loss (mL) 532.62 ± 490.75 ± 0.358
175.80 100.45
Mean blood transfusion 2.10 ± 0.83 1.90 ± 0.64 0.406
(packed RBC units)
Mean IV fluids (mL) 2785.71 ± 2925.00 ± 0.531
845.15 19.99
Hb reduction (gm/dL) 1.34 ± 0.37 1.15 ± 0.21 0.055
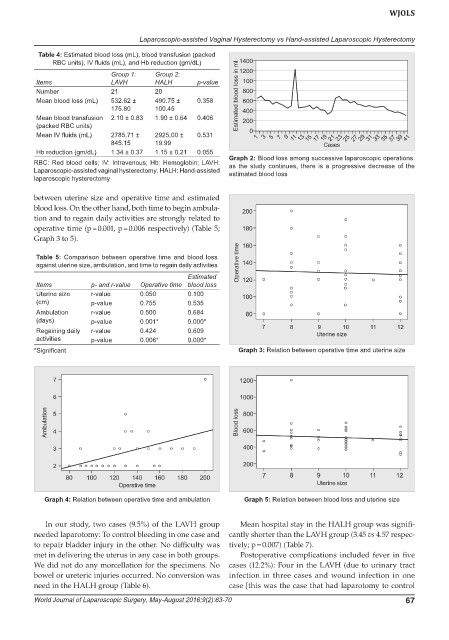
RBC: Red blood cells; IV: Intravenous; Hb: Hemoglobin; LAVH: Graph 2: Blood loss among successive laparoscopic operations:
as the study continues, there is a progressive decrease of the
Laparoscopic-assisted vaginal hysterectomy; HALH: Hand-assisted estimated blood loss
laparoscopic hysterectomy
between uterine size and operative time and estimated
blood loss. On the other hand, both time to begin ambula-
tion and to regain daily activities are strongly related to
operative time (p = 0.001, p = 0.006 respectively) (Table 5;
Graph 3 to 5).
Table 5: Comparison between operative time and blood loss
against uterine size, ambulation, and time to regain daily activities
Estimated
Items p- and r-value Operative time blood loss
Uterine size r-value 0.050 0.100
(cm) p-value 0.755 0.535
Ambulation r-value 0.500 0.684
(days) p-value 0.001* 0.000*
Regaining daily r-value 0.424 0.609
activities p-value 0.006* 0.000*
*Significant Graph 3: Relation between operative time and uterine size
Graph 4: Relation between operative time and ambulation Graph 5: Relation between blood loss and uterine size
In our study, two cases (9.5%) of the LAVH group Mean hospital stay in the HALH group was signifi-
needed laparotomy: To control bleeding in one case and cantly shorter than the LAVH group (3.45 vs 4.57 respec-
to repair bladder injury in the other. No difficulty was tively; p = 0.007) (Table 7).
met in delivering the uterus in any case in both groups. Postoperative complications included fever in five
We did not do any morcellation for the specimens. No cases (12.2%): Four in the LAVH (due to urinary tract
bowel or ureteric injuries occurred. No conversion was infection in three cases and wound infection in one
need in the HALH group (Table 6). case [this was the case that had laparotomy to control
World Journal of Laparoscopic Surgery, May-August 2016;9(2):63-70 67