
Page 55 - World Journal of Laparoscopic Surgery
P. 55
Laparoscopic Ventral vs Posterior Mesh Rectopexy for Rectal Prolapse
results
Gender and Age
Of 22 patients who underwent LPMR, 6 (27.27%) were males and
16 (72.73%) were females. On the other hand, of 22 patients who
underwent LVMR, there were 8 (36.36%) males and 14 (63.64%)
females with no significant difference between both groups
(p = 0.747). The patients’ ages ranged from 11 to 63 years old with
the mean age 42.43 ± 14.05 years and 40.5 years as a median. About
36.36% of patients were below 40-years old in group A, while about
40.91% of patients in group B with no significant difference between
groups as shown in Table 1.
Clinical Presentation
Complete rectal prolapse, constipation, fecal incontinence,
bleeding per rectum, obstructed defecation, and internal rectal
prolapse were the common symptoms in both groups. Clinical
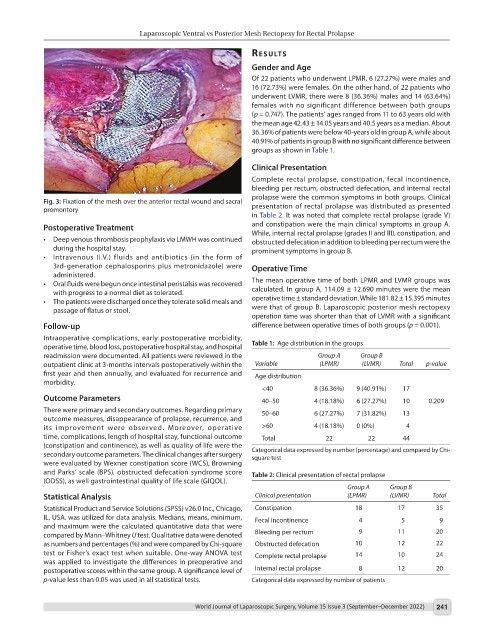
Fig. 3: Fixation of the mesh over the anterior rectal wound and sacral presentation of rectal prolapse was distributed as presented
promontory
in Table 2. It was noted that complete rectal prolapse (grade V)
Postoperative Treatment and constipation were the main clinical symptoms in group A.
While, internal rectal prolapse (grades II and III), constipation, and
• Deep venous thrombosis prophylaxis via LMWH was continued obstructed defecation in addition to bleeding per rectum were the
during the hospital stay. prominent symptoms in group B.
• Intravenous (I.V.) fluids and antibiotics (in the form of
3rd-generation cephalosporins plus metronidazole) were Operative Time
administered.
• Oral fluids were begun once intestinal peristalsis was recovered The mean operative time of both LPMR and LVMR groups was
with progress to a normal diet as tolerated. calculated. In group A, 114.09 ± 12.690 minutes were the mean
• The patients were discharged once they tolerate solid meals and operative time ± standard deviation. While 181.82 ± 15.395 minutes
passage of flatus or stool. were that of group B. Laparoscopic posterior mesh rectopexy
operation time was shorter than that of LVMR with a significant
Follow-up difference between operative times of both groups (p = 0.001).
Intraoperative complications, early postoperative morbidity,
operative time, blood loss, postoperative hospital stay, and hospital Table 1: Age distribution in the groups
readmission were documented. All patients were reviewed in the Group A Group B
outpatient clinic at 3-months intervals postoperatively within the Variable (LPMR) (LVMR) Total p-value
first year and then annually, and evaluated for recurrence and Age distribution
morbidity.
<40 8 (36.36%) 9 (40.91%) 17
Outcome Parameters 40–50 4 (18.18%) 6 (27.27%) 10 0.209
There were primary and secondary outcomes. Regarding primary 50–60 6 (27.27%) 7 (31.82%) 13
outcome measures, disappearance of prolapse, recurrence, and
its improvement were observed. Moreover, operative >60 4 (18.18%) 0 (0%) 4
time, complications, length of hospital stay, functional outcome Total 22 22 44
(constipation and continence), as well as quality of life were the
secondary outcome parameters. The clinical changes after surgery Categorical data expressed by number (percentage) and compared by Chi-
square test
were evaluated by Wexner constipation score (WCS), Browning
and Parks’ scale (BPS), obstructed defecation syndrome score Table 2: Clinical presentation of rectal prolapse
(ODSS), as well gastrointestinal quality of life scale (GIQOL).
Group A Group B
Statistical Analysis Clinical presentation (LPMR) (LVMR) Total
Statistical Product and Service Solutions (SPSS) v26.0 Inc., Chicago, Constipation 18 17 35
IL, USA. was utilized for data analysis. Medians, means, minimum, Fecal incontinence 4 5 9
and maximum were the calculated quantitative data that were
compared by Mann–Whitney U test. Qualitative data were denoted Bleeding per rectum 9 11 20
as numbers and percentages (%) and were compared by Chi-square Obstructed defecation 10 12 22
test or Fisher’s exact test when suitable. One-way ANOVA test Complete rectal prolapse 14 10 24
was applied to investigate the differences in preoperative and
postoperative scores within the same group. A significance level of Internal rectal prolapse 8 12 20
p-value less than 0.05 was used in all statistical tests. Categorical data expressed by number of patients
World Journal of Laparoscopic Surgery, Volume 15 Issue 3 (September–December 2022) 241