
Page 17 - World Journal of Laparoscopic Surgery
P. 17
Extracorporeal Knotting vs Clips for Ligating Cystic Duct
sAmplIng (prospectIve, InterventIonAl follow-up of 3 months. After the evaluation, patient was taken
study) for laparoscopic cholecystectomy and time taken from incision
to closure, bile/stone spillage and cost of clips/suture was noted.
1
On the basis of a study done by Kuldip Singh et al. at Patiala, the Postoperatively, cases were followed up for any complication.
anticipated mean ± SD of operating time by extracorporeal knotting
vs using clips was 60.50 ± 14.93 and 47.83 ± 14.77, respectively. Inclusion Criteria
The minimum sample size was 30 per group with 95% level of Patients with cholecystitis—calculous/acalculous and cholelithiasis
significance and 80% power. were included in the study.
Formula used was as follows: Exclusion Criteria
( 1−∝ /2 + Z β ) * Z S 2 Patients with cardiac disease, pregnant women, those who were
N = 2
d unfit for general anesthesia, and patients with CBD stone were
excluded.
Z 1–∝/2 —level of significance = 95%
Z 1–β —power of the study = 80% results
d = clinically significant difference between two parameters
SD = common standard deviation This case series analysis was conducted from November 2018 to
June 2020, i.e., for a period of 20 months; 60 cases were subjected
Statistical Analysis to laparoscopic cholecystectomy, and the following results were
Data were represented using mean ± SD, percentages, and observed.
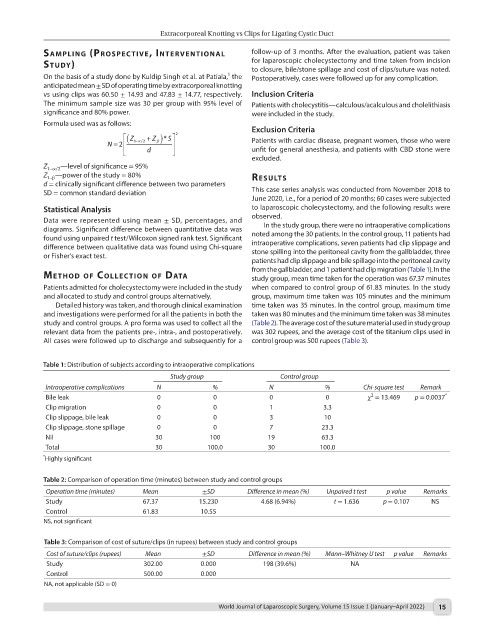
diagrams. Significant difference between quantitative data was In the study group, there were no intraoperative complications
found using unpaired t test/Wilcoxon signed rank test. Significant noted among the 30 patients. In the control group, 11 patients had
difference between qualitative data was found using Chi-square intraoperative complications, seven patients had clip slippage and
or Fisher’s exact test. stone spilling into the peritoneal cavity from the gallbladder, three
patients had clip slippage and bile spillage into the peritoneal cavity
from the gallbladder, and 1 patient had clip migration (Table 1). In the
method of collectIon of dAtA study group, mean time taken for the operation was 67.37 minutes
Patients admitted for cholecystectomy were included in the study when compared to control group of 61.83 minutes. In the study
and allocated to study and control groups alternatively. group, maximum time taken was 105 minutes and the minimum
Detailed history was taken, and thorough clinical examination time taken was 35 minutes. In the control group, maximum time
and investigations were performed for all the patients in both the taken was 80 minutes and the minimum time taken was 38 minutes
study and control groups. A pro forma was used to collect all the (Table 2). The average cost of the suture material used in study group
relevant data from the patients pre-, intra-, and postoperatively. was 302 rupees, and the average cost of the titanium clips used in
All cases were followed up to discharge and subsequently for a control group was 500 rupees (Table 3).
Table 1: Distribution of subjects according to intraoperative complications
Study group Control group
Intraoperative complications N % N % Chi-square test Remark
2
Bile leak 0 0 0 0 χ = 13.469 p = 0.0037 *
Clip migration 0 0 1 3.3
Clip slippage, bile leak 0 0 3 10
Clip slippage, stone spillage 0 0 7 23.3
Nil 30 100 19 63.3
Total 30 100.0 30 100.0
* Highly significant
Table 2: Comparison of operation time (minutes) between study and control groups
Operation time (minutes) Mean ±SD Difference in mean (%) Unpaired t test p value Remarks
Study 67.37 15.230 4.68 (6.94%) t = 1.636 p = 0.107 NS
Control 61.83 10.55
NS, not significant
Table 3: Comparison of cost of suture/clips (in rupees) between study and control groups
Cost of suture/clips (rupees) Mean ±SD Difference in mean (%) Mann–Whitney U test p value Remarks
Study 302.00 0.000 198 (39.6%) NA
Control 500.00 0.000
NA, not applicable (SD = 0)
World Journal of Laparoscopic Surgery, Volume 15 Issue 1 (January–April 2022) 15