
Page 38 - World Journal of Laparoscopic Surgery
P. 38
Preoperative Prediction of Difficult Laparoscopic Cholecystectomy
Table 4: Univariate analysis of preoperative factors compared to the final outcome of the surgery
Result
Preoperative factors Findings Easy Difficult p value Odds ratio
Age Age <50 years 47 (46.1%) 16 (15.7%) 0.002 3.801 (1.625–8.89)
Age >50 years 17 (16.7%) 22 (21.6%)
Gender Female 55 (53.9%) 32 (31.4%) 0.812 1.146 (0.373–3.516)
Male 9 (8.8%) 6 (5.9%)
H/o acute cholecystitis Absent 60 (58.8%) 10 (9.8%) <0.0001 42 (12.11–145.612)
Present 4 (3.9%) 28 (27.5%)
H/o dyspepsia Absent 26 (25.5%) 11 (10.8%) 0.236 1.679 (0.710–3.97)
Present 38 (37.3%) 27 (26.5%)
Diabetes mellitus Absent 62 (60.8%) 27 (26.5%) <0.0001 12.630 (2.62–60.88)
Present 2 (2.0%) 11 (10.8%)
Hypertension Absent 48 (47.1%) 30 (29.4%) 0.65 0.80 (0.305–2.09)
Present 16 (15.7%) 8 (7.8%)
Previous abdominal surgery Absent 47 (46.1%) 35 (34.3%) 0.022 0.237 (0.064–0.872)
Present 17 (16.7%) 3 (2.9%)
Previous ERCP Absent 63 (61.8%) 34 (33.3%) 0.043 7.41 (0.796–68.97)
Present 1 (1.0%) 4 (3.9%)
BMI <27.5 46 (45.1%) 16 (15.7%) 0.003 3.51 (1.51–8.16)
>27.5 18 (17.6%) 2 (1.6%)
Murphy’s sign Absent 36 (35.3%) 10 (9.8%) 0.003 3.60 (1.50–8.63)
Present 28 (27.5%) 28 (27.5%)
Palpabale gallbladder Absent 64 (62.7%) 31 (30.4%) <0.0001 NA
Present 0 (0%) 7 (6.9%)
USG: gallbladder wall thickness <4 mm 62 (60.8%) 23 (22.5%) <0.0001 20.21 (4.28–95.35)
>4 mm 2 (2.0%) 15 (14.7%)
Pericholecystic fluid Absent 64 (62.7%) 35 (34.3%) 0.023 NA
Present 0 (0%) 3 (2.9%)
USG: impacted stone Absent 52 (51.0%) 20 (19.6%) 0.002 3.90 (1.59–9.53)
Present 12 (11.8%) 18 (17.6%)
USG: contracted Absent 63 (61.8%) 32 (31.4%) 0.006 11.81 (1.36–102.36)
Present 1 (1.0%) 6 (5.9%)
Count 23 (28.8%) 16 (20.0%)
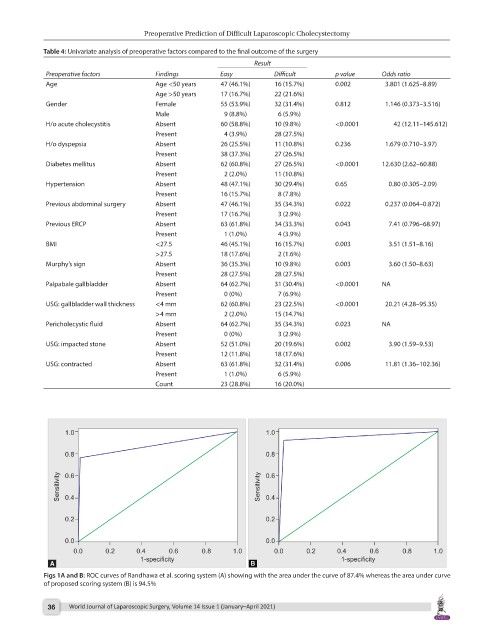
Figs 1A and B: ROC curves of Randhawa et al. scoring system (A) showing with the area under the curve of 87.4% whereas the area under curve
of proposed scoring system (B) is 94.5%
36 World Journal of Laparoscopic Surgery, Volume 14 Issue 1 (January–April 2021)