
Page 32 - World Journal of Laparoscopic Surgery
P. 32
Perioperative Outcome of Laparoscopy in the Management of Periappendiceal Abscess
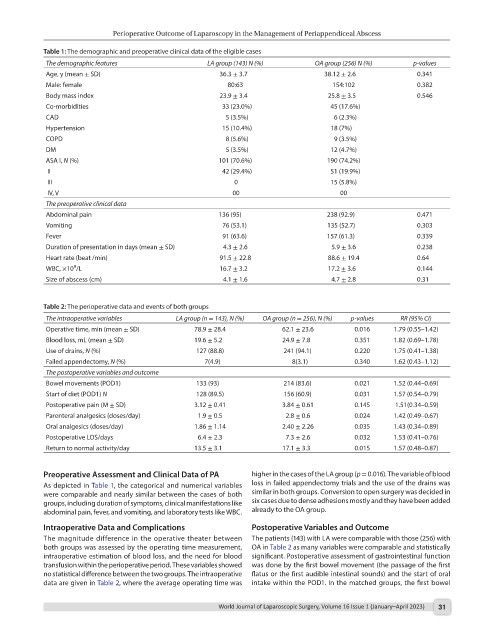
Table 1: The demographic and preoperative clinical data of the eligible cases
The demographic features LA group (143) N (%) OA group (256) N (%) p-values
Age, y (mean ± SD) 36.3 ± 3.7 38.12 ± 2.6 0.341
Male: female 80:63 154:102 0.382
Body mass index 23.9 ± 3.4 25.8 ± 3.5 0.546
Co-morbidities 33 (23.0%) 45 (17.6%)
CAD 5 (3.5%) 6 (2.3%)
Hypertension 15 (10.4%) 18 (7%)
COPD 8 (5.6%) 9 (3.5%)
DM 5 (3.5%) 12 (4.7%)
ASA I, N (%) 101 (70.6%) 190 (74.2%)
II 42 (29.4%) 51 (19.9%)
III 0 15 (5.8%)
IV, V 00 00
The preoperative clinical data
Abdominal pain 136 (95) 238 (92.9) 0.471
Vomiting 76 (53.1) 135 (52.7) 0.303
Fever 91 (63.6) 157 (61.3) 0.339
Duration of presentation in days (mean ± SD) 4.3 ± 2.6 5.9 ± 3.6 0.238
Heart rate (beat /min) 91.5 ± 22.8 88.6 ± 19.4 0.64
9
WBC, ×10 /L 16.7 ± 3.2 17.2 ± 3.6 0.144
Size of abscess (cm) 4.1 ± 1.6 4.7 ± 2.8 0.31
Table 2: The perioperative data and events of both groups
The intraoperative variables LA group (n = 143), N (%) OA group (n = 256), N (%) p-values RR (95% CI)
Operative time, min (mean ± SD) 78.9 ± 28.4 62.1 ± 23.6 0.016 1.79 (0.55–1.42)
Blood loss, mL (mean ± SD) 19.6 ± 5.2 24.9 ± 7.8 0.351 1.82 (0.69–1.78)
Use of drains, N (%) 127 (88.8) 241 (94.1) 0.220 1.75 (0.41–1.38)
Failed appendectomy, N (%) 7(4.9) 8(3.1) 0.340 1.62 (0.43–1.12)
The postoperative variables and outcome
Bowel movements (POD1) 133 (93) 214 (83.6) 0.021 1.52 (0.44–0.69)
Start of diet (POD1) N 128 (89.5) 156 (60.9) 0.031 1.57 (0.54–0.79)
Postoperative pain (M ± SD) 3.12 ± 0.41 3.84 ± 0.61 0.145 1.51(0.34–0.59)
Parenteral analgesics (doses/day) 1.9 ± 0.5 2.8 ± 0.6 0.024 1.42 (0.49–0.67)
Oral analgesics (doses/day) 1.86 ± 1.14 2.40 ± 2.26 0.035 1.43 (0.34–0.89)
Postoperative LOS/days 6.4 ± 2.3 7.3 ± 2.6 0.032 1.53 (0.41–0.76)
Return to normal activity/day 13.5 ± 3.1 17.1 ± 3.3 0.015 1.57 (0.48–0.87)
Preoperative Assessment and Clinical Data of PA higher in the cases of the LA group (p = 0.016). The variable of blood
As depicted in Table 1, the categorical and numerical variables loss in failed appendectomy trials and the use of the drains was
were comparable and nearly similar between the cases of both similar in both groups. Conversion to open surgery was decided in
groups, including duration of symptoms, clinical manifestations like six cases due to dense adhesions mostly and they have been added
abdominal pain, fever, and vomiting, and laboratory tests like WBC. already to the OA group.
Intraoperative Data and Complications Postoperative Variables and Outcome
The magnitude difference in the operative theater between The patients (143) with LA were comparable with those (256) with
both groups was assessed by the operating time measurement, OA in Table 2 as many variables were comparable and statistically
intraoperative estimation of blood loss, and the need for blood significant. Postoperative assessment of gastrointestinal function
transfusion within the perioperative period. These variables showed was done by the first bowel movement (the passage of the first
no statistical difference between the two groups. The intraoperative flatus or the first audible intestinal sounds) and the start of oral
data are given in Table 2, where the average operating time was intake within the POD1. In the matched groups, the first bowel
World Journal of Laparoscopic Surgery, Volume 16 Issue 1 (January–April 2023) 31