Page 37 - tmp
P. 37

Incidental CaGB in Operated Cases of Gallstone Disease
            Other Demographic Profiles                         Table 4: Age comparison in CaGB vs chronic cholecystitis patients
            •  Among incidental CaGB patients, 40% were male and 60% were   (N = 200)
              female; 29.74% of chronic cholecystitis patients were male and                 Cases
              70.1% were female (Table 6).                                        Valid     Missing    Total
            •  Regarding incidental CaGB patients, 40% were doing desk job,   Diagnosis  N  %  N  %  N     %
              60% were housewives.
            •  Among chronic cholecystitis patients, 19.48% were doing desk job,   Age  CaGB  5  100.0  0  0.0  5  100.0
              9.2% were retired persons, and 66.66% were housewives (Table 6).  Chronic    195  100.0  0  0.0  195  100.0
            •  In total, 40% of incidental CaGB patients lived in rural area and   cholecystitis
              60% in urban area; 69.23% of chronic cholecystitis patients lived
              in rural area and 30.77% in urban area (Table 6).
            •  Table 7 shows statistical tests for demographic profiles in CaGB   Table 5: Age distribution in CaGB vs chronic cholecystitis patients
              vs chronic cholecystitis patients.               (N = 200)
                                                                Age          CaGB (N = 5)  Chronic cholecystitis (N = 195)
                                                                Minimum age      30               6
                                                                Maximum age      76              78
                                                                Median age       36              44


                                                               Table 6: Demographic profiles in CaGB vs chronic cholecystitis patients
                                                               (N = 200)
                                                                              Incidental   Chronic cholecystitis   Total
                                                                              CaGB (n = 5)  (n = 195)   (n = 200)
                                                                Case profile  No.  %    No.     %      No.   %
                                                                Sex: male     2    40    58    29.74   60    30
                                                                Sex: female   3    60   137    70.16   140   70
                                                                Occupation: desk   2  40  38   19.48   40    20
                                                                job
                                                                Occupation:   0    0     18     9.2    18    9
                                                                retired person
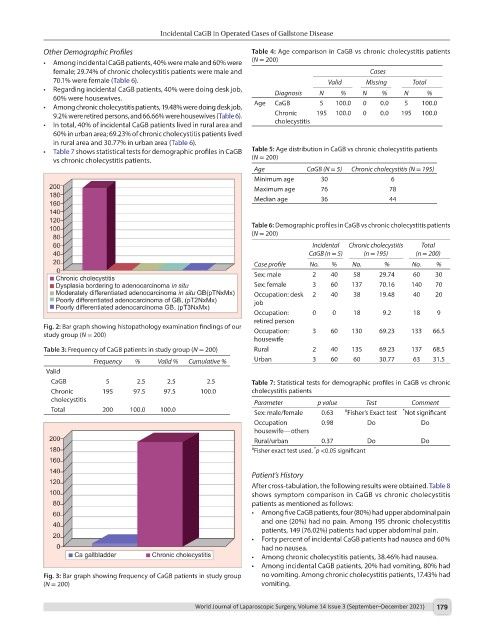
            Fig. 2: Bar graph showing histopathology examination findings of our   Occupation:   3  60  130  69.23  133  66.5
            study group (N = 200)
                                                                housewife
            Table 3: Frequency of CaGB patients in study group (N = 200)  Rural  2  40  135    69.23   137  68.5
                        Frequency  %    Valid %  Cumulative %   Urban         3    60    60    30.77   63   31.5
            Valid
              CaGB         5        2.5     2.5       2.5      Table 7: Statistical tests for demographic profiles in CaGB vs chronic
                Chronic    195     97.5    97.5    100.0       cholecystitis patients
              cholecystitis                                     Parameter       p value     Test       Comment
              Total       200    100.0   100.0                  Sex: male/female  0.63  # Fisher’s Exact test  * Not significant
                                                                Occupation       0.98       Do           Do
                                                                housewife—others
                                                                Rural/urban      0.37       Do           Do
                                                                               *
                                                               # Fisher exact test used.  p <0.05 significant

                                                               Patient’s History
                                                               After cross-tabulation, the following results were obtained. Table 8
                                                               shows symptom comparison in CaGB vs chronic cholecystitis
                                                               patients as mentioned as follows:
                                                               •  Among five CaGB patients, four (80%) had upper abdominal pain
                                                                  and one (20%) had no pain. Among 195 chronic cholecystitis
                                                                  patients, 149 (76.02%) patients had upper abdominal pain.
                                                               •  Forty percent of incidental CaGB patients had nausea and 60%
                                                                  had no nausea.
                                                               •  Among chronic cholecystitis patients, 38.46% had nausea.
                                                               •  Among incidental CaGB patients, 20% had vomiting, 80% had
            Fig. 3: Bar graph showing frequency of CaGB patients in study group   no vomiting. Among chronic cholecystitis patients, 17.43% had
            (N = 200)                                             vomiting.

                                                 World Journal of Laparoscopic Surgery, Volume 14 Issue 3 (September–December 2021)  179
   32   33   34   35   36   37   38   39   40   41   42