
Page 26 - tmp
P. 26
Intraoperative Finding and Ultrasonographic Scoring for Predicting DLC
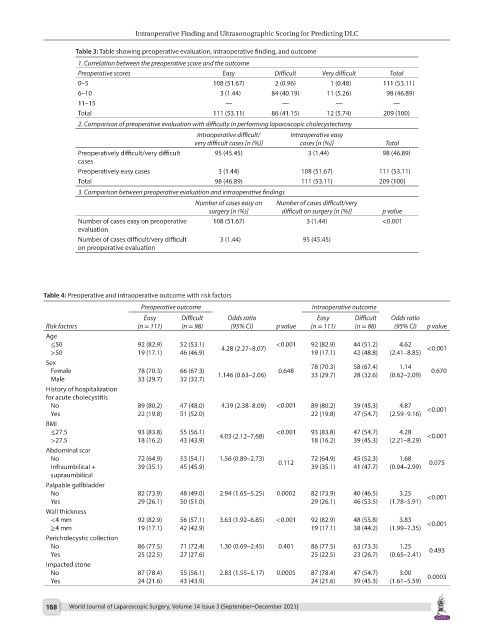
Table 3: Table showing preoperative evaluation, intraoperative finding, and outcome
1. Correlation between the preoperative score and the outcome
Preoperative scores Easy Difficult Very difficult Total
0–5 108 (51.67) 2 (0.96) 1 (0.48) 111 (53.11)
6–10 3 (1.44) 84 (40.19) 11 (5.26) 98 (46.89)
11–15 — — — —
Total 111 (53.11) 86 (41.15) 12 (5.74) 209 (100)
2. Comparison of preoperative evaluation with difficulty in performing laparoscopic cholecystectomy
Intraoperative difficult/ Intraoperative easy
very difficult cases [n (%)] cases [n (%)] Total
Preoperatively difficult/very difficult 95 (45.45) 3 (1.44) 98 (46.89)
cases
Preoperatively easy cases 3 (1.44) 108 (51.67) 111 (53.11)
Total 98 (46.89) 111 (53.11) 209 (100)
3. Comparison between preoperative evaluation and intraoperative findings
Number of cases easy on Number of cases difficult/very
surgery [n (%)] difficult on surgery [n (%)] p value
Number of cases easy on preoperative 108 (51.67) 3 (1.44) <0.001
evaluation
Number of cases difficult/very difficult 3 (1.44) 95 (45.45)
on preoperative evaluation
Table 4: Preoperative and intraoperative outcome with risk factors
Preoperative outcome Intraoperative outcome
Easy Difficult Odds ratio Easy Difficult Odds ratio
Risk factors (n = 111) (n = 98) (95% CI) p value (n = 111) (n = 86) (95% CI) p value
Age
≤50 92 (82.9) 52 (53.1) 4.28 (2.27–8.07) <0.001 92 (82.9) 44 (51.2) 4.62 <0.001
>50 19 (17.1) 46 (46.9) 19 (17.1) 42 (48.8) (2.41–8.85)
Sex
1.14
Female 78 (70.3) 66 (67.3) 1.146 (0.63–2.06) 0.648 78 (70.3) 58 (67.4) (0.62–2.09) 0.670
33 (29.7)
28 (32.6)
Male 33 (29.7) 32 (32.7)
History of hospitalization
for acute cholecystitis
No 89 (80.2) 47 (48.0) 4.39 (2.38–8.09) <0.001 89 (80.2) 39 (45.3) 4.87 <0.001
Yes 22 (19.8) 51 (52.0) 22 (19.8) 47 (54.7) (2.59–9.16)
BMI
≤27.5 93 (83.8) 55 (56.1) 4.03 (2.12–7.68) <0.001 93 (83.8) 47 (54.7) 4.28 <0.001
>27.5 18 (16.2) 43 (43.9) 18 (16.2) 39 (45.3) (2.21–8.29)
Abdominal scar
No 72 (64.9) 53 (54.1) 1.56 (0.89–2.73) 0.112 72 (64.9) 45 (52.3) 1.68 0.075
Infraumbilical + 39 (35.1) 45 (45.9) 39 (35.1) 41 (47.7) (0.94–2.99)
supraumbilical
Palpable gallbladder
No 82 (73.9) 48 (49.0) 2.94 (1.65–5.25) 0.0002 82 (73.9) 40 (46.5) 3.25 <0.001
Yes 29 (26.1) 50 (51.0) 29 (26.1) 46 (53.5) (1.78–5.91)
Wall thickness
<4 mm 92 (82.9) 56 (57.1) 3.63 (1.92–6.85) <0.001 92 (82.9) 48 (55.8) 3.83 <0.001
≥4 mm 19 (17.1) 42 (42.9) 19 (17.1) 38 (44.2) (1.99–7.35)
Pericholecystic collection
No 86 (77.5) 71 (72.4) 1.30 (0.69–2.45) 0.401 86 (77.5) 63 (73.3) 1.25 0.493
Yes 25 (22.5) 27 (27.6) 25 (22.5) 23 (26.7) (0.65–2.41)
Impacted stone
No 87 (78.4) 55 (56.1) 2.83 (1.55–5.17) 0.0005 87 (78.4) 47 (54.7) 3.00
Yes 24 (21.6) 43 (43.9) 24 (21.6) 39 (45.3) (1.61–5.59) 0.0003
168 World Journal of Laparoscopic Surgery, Volume 14 Issue 3 (September–December 2021)