Page 27 - WJOLS
P. 27

Elective Laparoscopic Left Colectomy for Diverticular Disease: A Monocentric Study on 205 Consecutive Patients

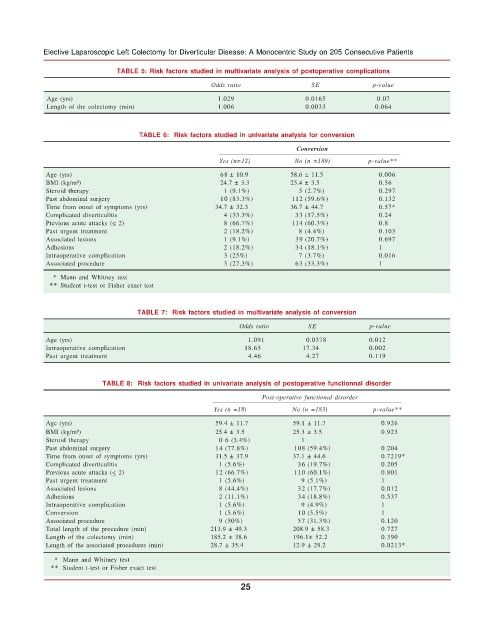
                              TABLE 5: Risk factors studied in multivariate analysis of postoperative complications

                                                     Odds ratio               SE             p-value
             Age (yrs)                                 1.029                 0.0165           0.07
             Length of the colectomy (min)             1.006                 0.0033           0.064


                                   TABLE 6:  Risk factors studied in univariate analysis for conversion
                                                                           Conversion
                                                       Yes (n=12)         No (n =189)       p-value**
            Age (yrs)                                   68 ±  10.9       58.6 ± 11.5           0.006
            BMI (kg/m²)                                 24.7 ± 3.3       25.4 ± 3.5            0.56
            Steroid therapy                              1 (9.1%)          5 (2.7%)            0.297
            Past abdominal surgery                      10 (83.3%)       112 (59.6%)           0.132
            Time from onset of symptoms (yrs)         34.7 ± 32.3        36.7 ± 44.7           0.57*
            Complicated diverticulitis                   4 (33.3%)        33 (17.5%)           0.24
            Previous acute attacks (< 2)                 8 (66.7%)       114 (60.3%)           0.8
            Past urgent treatment                        2 (18.2%)         8 (4.4%)            0.103
            Associated lesions                           1 (9.1%)         39 (20.7%)           0.697
            Adhesions                                    2 (18.2%)        34 (18.1%)           1
            Intraoperative complication                  3 (25%)           7 (3.7%)            0.016
            Associated procedure                         3 (27.3%)        63 (33.3%)           1
              * Mann and Whitney test
             ** Student t-test or Fisher exact test


                                   TABLE 7:  Risk factors studied in multivariate analysis of conversion
                                                            Odds ratio       SE              p-value
            Age (yrs)                                         1.091          0.0378          0.012
            Intraoperative complication                       18.65         17.34            0.002
            Past urgent treatment                             4.46           4.27           0.119


                          TABLE 8:  Risk factors studied in univariate analysis of postoperative functionnal disorder
                                                                  Post-operative functional disorder
                                                      Yes (n =18)        No (n =183)         p-value**
            Age (yrs)                                 59.4 ± 11.7         59.1 ± 11.7          0.926
            BMI (kg/m²)                               25.4 ± 3.5          25.3 ± 3.5           0.923
            Steroid therapy                            0 6 (3.4%)           1
            Past abdominal surgery                    14 (77.8%)          108 (59.4%)          0.204
            Time from onset of symptoms (yrs)         31.5 ± 37.9         37.1 ± 44.6          0.7219*
            Complicated diverticulitis                 1 (5.6%)            36 (19.7%)          0.205
            Previous acute attacks (< 2)              12 (66.7%)          110 (60.1%)          0.801
            Past urgent treatment                      1 (5.6%)             9 (5.1%)           1
            Associated lesions                         8 (44.4%)           32 (17.7%)          0.012
            Adhesions                                  2 (11.1%)           34 (18.8%)          0.537
            Intraoperative complication                1 (5.6%)             9 (4.9%)           1
            Conversion                                 1 (5.6%)            10 (5.5%)           1
            Associated procedure                       9 (50%)             57 (31.3%)          0.120
            Total length of the procedure (min)      213.9 ± 49.3         208.9 ± 58.3         0.727
            Length of the colectomy (min)            185.2 ± 38.6         196.1± 52.2          0.390
            Length of the associated procedures (min)  28.7 ± 35.4        12.9 ± 29.2          0.0213*
               * Mann and Whitney test
              ** Student t-test or Fisher exact test

                                                             25
   22   23   24   25   26   27   28   29   30   31   32