
Page 48 - World Journal of Laparoscopic Surgery
P. 48
Isreb S et al
unmarked instruments, and to look at other factors that might
influence precision.
METHODS
Twenty-two surgeons with previous laparoscopic surgery
exposure were recruited to the study, eight consultants and
eleven senior surgical trainees at Sunderland city hospital
general surgical department. Three visiting senior trainees from
Gateshead Health NHS Foundation Trust were also included.
Candidates were asked to estimate 150 cm on a piece of string
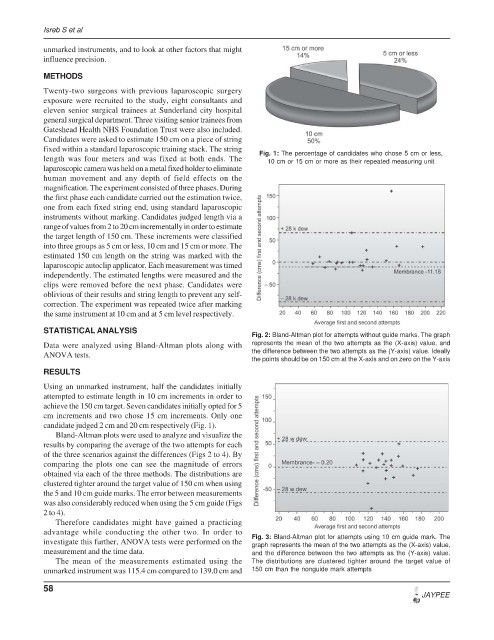
fixed within a standard laparoscopic training stack. The string Fig. 1: The percentage of candidates who chose 5 cm or less,
length was four meters and was fixed at both ends. The 10 cm or 15 cm or more as their repeated measuring unit
laparoscopic camera was held on a metal fixed holder to eliminate
human movement and any depth of field effects on the
magnification. The experiment consisted of three phases. During
the first phase each candidate carried out the estimation twice,
one from each fixed string end, using standard laparoscopic
instruments without marking. Candidates judged length via a
range of values from 2 to 20 cm incrementally in order to estimate
the target length of 150 cm. These increments were classified
into three groups as 5 cm or less, 10 cm and 15 cm or more. The
estimated 150 cm length on the string was marked with the
laparoscopic autoclip applicator. Each measurement was timed
independently. The estimated lengths were measured and the
clips were removed before the next phase. Candidates were
oblivious of their results and string length to prevent any self-
correction. The experiment was repeated twice after marking
the same instrument at 10 cm and at 5 cm level respectively.
STATISTICAL ANALYSIS
Fig. 2: Bland-Altman plot for attempts without guide marks. The graph
Data were analyzed using Bland-Altman plots along with represents the mean of the two attempts as the (X-axis) value, and
ANOVA tests. the difference between the two attempts as the (Y-axis) value. Ideally
the points should be on 150 cm at the X-axis and on zero on the Y-axis
RESULTS
Using an unmarked instrument, half the candidates initially
attempted to estimate length in 10 cm increments in order to
achieve the 150 cm target. Seven candidates initially opted for 5
cm increments and two chose 15 cm increments. Only one
candidate judged 2 cm and 20 cm respectively (Fig. 1).
Bland-Altman plots were used to analyze and visualize the
results by comparing the average of the two attempts for each
of the three scenarios against the differences (Figs 2 to 4). By
comparing the plots one can see the magnitude of errors
obtained via each of the three methods. The distributions are
clustered tighter around the target value of 150 cm when using
the 5 and 10 cm guide marks. The error between measurements
was also considerably reduced when using the 5 cm guide (Figs
2 to 4).
Therefore candidates might have gained a practicing
advantage while conducting the other two. In order to
investigate this further, ANOVA tests were performed on the Fig. 3: Bland-Altman plot for attempts using 10 cm guide mark. The
graph represents the mean of the two attempts as the (X-axis) value,
measurement and the time data. and the difference between the two attempts as the (Y-axis) value.
The mean of the measurements estimated using the The distributions are clustered tighter around the target value of
unmarked instrument was 115.4 cm compared to 139.0 cm and 150 cm than the nonguide mark attempts
58
JAYPEE