
Page 5 - World Journal of Laparoscopic Surgery
P. 5
WJOLS
Difference between the Inflammatory Reaction Caused by the Placement of a Conventional Laparoscopic Access
ReSuLTS DISCuSSIon
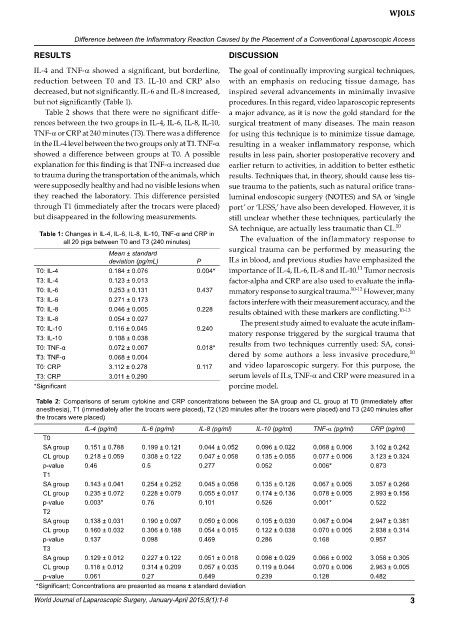
IL4 and TNFa showed a significant, but borderline, The goal of continually improving surgical techniques,
reduction between T0 and T3. IL10 and CRP also with an emphasis on reducing tissue damage, has
decreased, but not significantly. IL-6 and IL-8 increased, inspired several advancements in minimally invasive
but not significantly (Table 1). procedures. In this regard, video laparoscopic represents
Table 2 shows that there were no significant diffe- a major advance, as it is now the gold standard for the
rences between the two groups in IL4, IL6, IL8, IL10, surgical treatment of many diseases. The main reason
TNFa or CRP at 240 minutes (T3). There was a difference for using this technique is to minimize tissue damage,
in the IL4 level between the two groups only at T1. TNFa resulting in a weaker inflammatory response, which
showed a difference between groups at T0. A possible results in less pain, shorter postoperative recovery and
explanation for this finding is that TNF-a increased due earlier return to activities, in addition to better esthetic
to trauma during the transportation of the animals, which results. Techniques that, in theory, should cause less tis
were supposedly healthy and had no visible lesions when sue trauma to the patients, such as natural orifice trans
they reached the laboratory. This difference persisted luminal endoscopic surgery (NOTES) and SA or ‘single
through T1 (immediately after the trocars were placed) port’ or ‘LESS,’ have also been developed. However, it is
but disappeared in the following measurements. still unclear whether these techniques, particularly the
SA technique, are actually less traumatic than CL. 10
Table 1: Changes in IL-4, IL-6, IL-8, IL-10, TNF-α and CRP in
all 20 pigs between T0 and T3 (240 minutes) The evaluation of the inflammatory response to
surgical trauma can be performed by measuring the
Mean ± standard
deviation (pg/mL) P ILs in blood, and previous studies have emphasized the
11
T0: IL-4 0.184 ± 0.076 0.004* importance of IL4, IL6, IL8 and IL10. Tumor necrosis
T3: IL-4 0.123 ± 0.013 factor-alpha and CRP are also used to evaluate the infla-
T0: IL-6 0.253 ± 0.131 0.437 mmatory response to surgical trauma. 1012 However, many
T3: IL-6 0.271 ± 0.173 factors interfere with their measurement accuracy, and the
T0: IL-8 0.046 ± 0.005 0.228 results obtained with these markers are conflicting. 1013
T3: IL-8 0.054 ± 0.027 The present study aimed to evaluate the acute inflam
T0: IL-10 0.116 ± 0.045 0.240 matory response triggered by the surgical trauma that
T3: IL-10 0.108 ± 0.038
T0: TNF-α 0.072 ± 0.007 0.018* results from two techniques currently used: SA, consi
10
T3: TNF-α 0.068 ± 0.004 dered by some authors a less invasive procedure,
T0: CRP 3.112 ± 0.278 0.117 and video laparoscopic surgery. For this purpose, the
T3: CRP 3.011 ± 0.290 serum levels of ILs, TNFa and CRP were measured in a
*Significant porcine model.
Table 2: Comparisons of serum cytokine and CRP concentrations between the SA group and CL group at T0 (immediately after
anesthesia), T1 (immediately after the trocars were placed), T2 (120 minutes after the trocars were placed) and T3 (240 minutes after
the trocars were placed)
IL-4 (pg/ml) IL-6 (pg/ml) IL-8 (pg/ml) IL-10 (pg/ml) TNF-a (pg/ml) CRP (pg/ml)
T0
SA group 0.151 ± 0.788 0.199 ± 0.121 0.044 ± 0.052 0.096 ± 0.022 0.068 ± 0.006 3.102 ± 0.242
CL group 0.218 ± 0.059 0.308 ± 0.122 0.047 ± 0.058 0.135 ± 0.055 0.077 ± 0.006 3.123 ± 0.324
p-value 0.46 0.5 0.277 0.052 0.006* 0.873
T1
SA group 0.143 ± 0.041 0.254 ± 0.252 0.045 ± 0.058 0.135 ± 0.126 0.067 ± 0.005 3.057 ± 0.266
CL group 0.235 ± 0.072 0.228 ± 0.079 0.055 ± 0.017 0.174 ± 0.136 0.078 ± 0.005 2.993 ± 0.156
p-value 0.003* 0.76 0.101 0.526 0.001* 0.522
T2
SA group 0.138 ± 0.031 0.190 ± 0.097 0.050 ± 0.006 0.105 ± 0.030 0.067 ± 0.004 2.947 ± 0.381
CL group 0.160 ± 0.032 0.306 ± 0.188 0.054 ± 0.015 0.122 ± 0.038 0.070 ± 0.005 2.938 ± 0.314
p-value 0.137 0.098 0.469 0.286 0.168 0.957
T3
SA group 0.129 ± 0.012 0.227 ± 0.122 0.051 ± 0.018 0.098 ± 0.029 0.066 ± 0.002 3.058 ± 0.305
CL group 0.118 ± 0.012 0.314 ± 0.209 0.057 ± 0.035 0.119 ± 0.044 0.070 ± 0.006 2.963 ± 0.005
p-value 0.061 0.27 0.649 0.239 0.128 0.482
*Significant; Concentrations are presented as means ± standard deviation
World Journal of Laparoscopic Surgery, January-April 2015;8(1):1-6 3