
Page 24 - World Journal of Laparoscopic Surgery
P. 24
Nava Navaneethan, Peter Hewett
Statistical Analysis The interaction effect of surgical level and warm-
up was not included in the model because it was not a
Performance on the laparoscopic trainer is recorded and
analyzed by a software (InSTrAC) and quantitative significant predictor of time. A significant interaction
measures are obtained. effect would suggest that the effect of warming up differs
Data were analyzed using a general linear model between surgical levels (i.e. if warming up resulted in
testing. For all statistical analyses, a p-value less than 0.05 lower times for medical students, but did not make any
was considered statistically significant (Flow Chart 1). difference to time for surgeons). The interaction effect was
not significant in this model though, suggesting that the
RESuLTS effect of warming up was the same for medical students,
surgical trainees and surgeons.
Descriptive statistics were produced for each of the Post hoc comparisons of the surgical level group were
four response variables (time, acceleration, smoothness performed to compare mean times between the surgi-
and working areas) by surgical level (medical student, cal levels. This showed that surgeons had significantly
surgical trainee and surgeon) and warm-up. lower mean time than medical students (p = 0.0084) and
A general linear model was fit to test the effect of surgical trainees (p = 0.0072). There was no significant
surgical level and warm-up on each of the four response difference between mean time for surgical trainees and
variables. The results of the 4 models are summarized medical students (p = 0.9145) (Graph 1 and Table 2).
below (Table 1). Surgical level was a significant predictor of accelera-
Surgical level was a significant predictor of time when tion (p = 0.0004), While warm-up improved acceleration
controlling for warm-up (p = 0.0112). But warm-up was in all groups but warm-up was not clinically significant
not a significant predictor for time when controlling (p = 0.2157).
for surgical level (p = 0.9589). In other words, there is Post hoc comparisons of the surgical level group
evidence that surgical level has an effect on time. While
warm-up reduced the mean time of operation in surgeons showed surgeons had significantly lower mean accele-
and medical students group. But they were not to the ration than medical students (p = 0.0035) and surgical
level of clinically significant. trainees (p = 0.0001). There was no significant difference
between mean acceleration for surgical trainees and
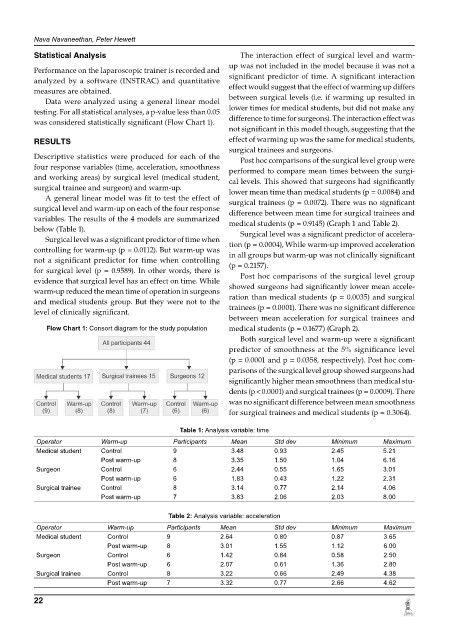
Flow Chart 1: Consort diagram for the study population medical students (p = 0.1677) (Graph 2).
Both surgical level and warm-up were a significant
predictor of smoothness at the 5% significance level
(p = 0.0001 and p = 0.0358, respectively). Post hoc com-
parisons of the surgical level group showed surgeons had
significantly higher mean smoothness than medical stu-
dents (p < 0.0001) and surgical trainees (p = 0.0009). There
was no significant difference between mean smoothness
for surgical trainees and medical students (p = 0.3064).
Table 1: Analysis variable: time
Operator Warm-up Participants Mean Std dev Minimum Maximum
Medical student Control 9 3.48 0.93 2.45 5.21
Post warm-up 8 3.35 1.50 1.04 6.16
Surgeon Control 6 2.44 0.55 1.65 3.01
Post warm-up 6 1.83 0.43 1.22 2.31
Surgical trainee Control 8 3.14 0.77 2.14 4.06
Post warm-up 7 3.83 2.06 2.03 8.00
Table 2: Analysis variable: acceleration
Operator Warm-up Participants Mean Std dev Minimum Maximum
Medical student Control 9 2.64 0.80 0.87 3.65
Post warm-up 8 3.01 1.55 1.12 6.00
Surgeon Control 6 1.42 0.84 0.58 2.50
Post warm-up 6 2.07 0.61 1.36 2.80
Surgical trainee Control 8 3.22 0.66 2.49 4.38
Post warm-up 7 3.32 0.77 2.66 4.62
22