
Page 39 - World Journal of Laparoscopic Surgery
P. 39
Preoperative Scoring System to Predict Difficult LC
Table 7: Correlation between preoperative score with duration of
surgery and duration of hospital stay
Preoperative score
Preoperative score Pearson correlation (r) 1
p-value
N 66
Duration of surgery Pearson correlation (r) 0.752
(in minutes) p-value <0.001
N 66
Duration of hospital Pearson correlation (r) 0.788
stay p-value <0.001
N 66
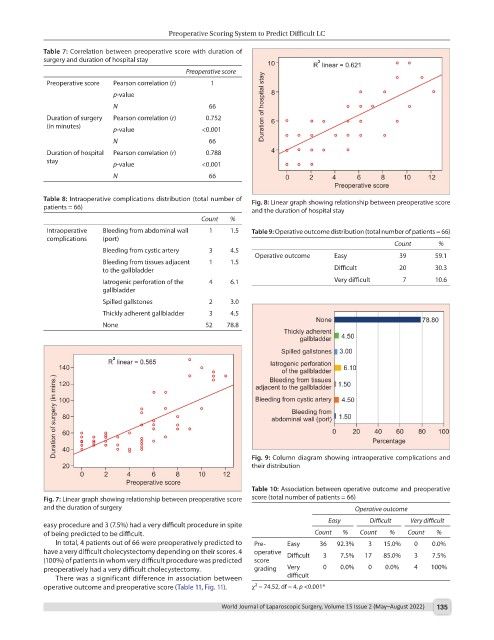
Table 8: Intraoperative complications distribution (total number of Fig. 8: Linear graph showing relationship between preoperative score
patients = 66) and the duration of hospital stay
Count %
Intraoperative Bleeding from abdominal wall 1 1.5 Table 9: Operative outcome distribution (total number of patients = 66)
complications (port)
Count %
Bleeding from cystic artery 3 4.5
Operative outcome Easy 39 59.1
Bleeding from tissues adjacent 1 1.5
to the gallbladder Difficult 20 30.3
Iatrogenic perforation of the 4 6.1 Very difficult 7 10.6
gallbladder
Spilled gallstones 2 3.0
Thickly adherent gallbladder 3 4.5
None 52 78.8
Fig. 9: Column diagram showing intraoperative complications and
their distribution
Table 10: Association between operative outcome and preoperative
Fig. 7: Linear graph showing relationship between preoperative score score (total number of patients = 66)
and the duration of surgery Operative outcome
Easy Difficult Very difficult
easy procedure and 3 (7.5%) had a very difficult procedure in spite
of being predicted to be difficult. Count % Count % Count %
In total, 4 patients out of 66 were preoperatively predicted to Pre- Easy 36 92.3% 3 15.0% 0 0.0%
have a very difficult cholecystectomy depending on their scores. 4 operative Difficult 3 7.5% 17 85.0% 3 7.5%
(100%) of patients in whom very difficult procedure was predicted score
preoperatively had a very difficult cholecystectomy. grading Very 0 0.0% 0 0.0% 4 100%
There was a significant difference in association between difficult
2
operative outcome and preoperative score (Table 11, Fig. 11). χ = 74.52, df = 4, p <0.001*
World Journal of Laparoscopic Surgery, Volume 15 Issue 2 (May–August 2022) 135