
Page 37 - World Journal of Laparoscopic Surgery
P. 37
Preoperative Scoring System to Predict Difficult LC
Table 1: Validity of a test in screening of disease Table 2: History parameters distribution (total number of patients = 66)
Diagnosis Count %
Screening
test results Diseased Healthy Total Age ≤50 years 49 74.2
Positive a (True positive) b (False positive) a + b >50 years 17 25.8
Negative c (False negative) d (True negative) c + d Sex Female 46 69.7
Total a + c b + d a + b + c + d Male 20 30.3
History of hospitalization No 53 80.3
for cholecystitis
Very difficult Yes 13 19.7
• Conversion
• Time taken is >120 min
All the cases have had preanesthetic fitness, a routine work-up,
and were taken up for surgery by a single surgeon. The duration
of surgery was calculated from incision to port closure. We
have calculated the preoperative degree of difficulty using our
predictive parameters and are going to compare the outcome to our
intraoperative findings. Duration of hospital stay was also tabulated.
results
Statistical Analysis
Data were entered into Microsoft Excel data sheet and were
analyzed using SPSS 22 version software. Continuous data were
represented as mean and standard deviation. Categorical data was
represented in the form of frequencies and proportions. Chi-square
test was used as test of significance for qualitative data (Table 1). 14–16
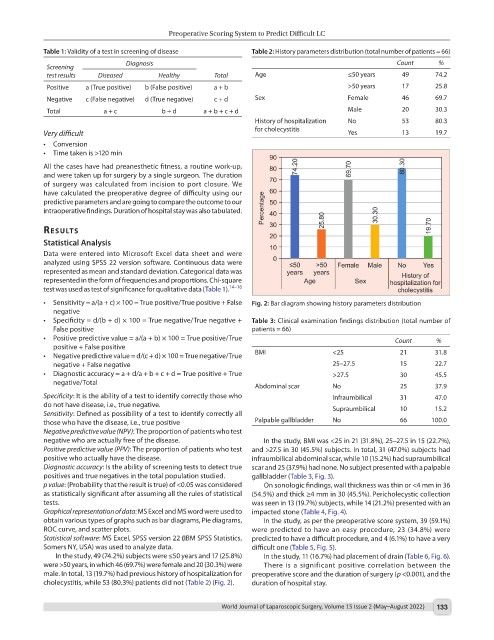
• Sensitivity = a/(a + c) × 100 = True positive/True positive + False Fig. 2: Bar diagram showing history parameters distribution
negative
• Specificity = d/(b + d) × 100 = True negative/True negative + Table 3: Clinical examination findings distribution (total number of
False positive patients = 66)
• Positive predictive value = a/(a + b) × 100 = True positive/True Count %
positive + False positive
• Negative predictive value = d/(c + d) × 100 = True negative/True BMI <25 21 31.8
negative + False negative 25–27.5 15 22.7
• Diagnostic accuracy = a + d/a + b + c + d = True positive + True >27.5 30 45.5
negative/Total
Abdominal scar No 25 37.9
Specificity: It is the ability of a test to identify correctly those who Infraumbilical 31 47.0
do not have disease, i.e., true negative. Supraumbilical 10 15.2
Sensitivity: Defined as possibility of a test to identify correctly all
those who have the disease, i.e., true positive Palpable gallbladder No 66 100.0
Negative predictive value (NPV): The proportion of patients who test
negative who are actually free of the disease. In the study, BMI was <25 in 21 (31.8%), 25–27.5 in 15 (22.7%),
Positive predictive value (PPV): The proportion of patients who test and >27.5 in 30 (45.5%) subjects. In total, 31 (47.0%) subjects had
positive who actually have the disease. infraumbilical abdominal scar, while 10 (15.2%) had supraumbilical
Diagnostic accuracy: Is the ability of screening tests to detect true scar and 25 (37.9%) had none. No subject presented with a palpable
positives and true negatives in the total population studied. gallbladder (Table 3, Fig. 3).
p value: (Probability that the result is true) of <0.05 was considered On sonologic findings, wall thickness was thin or <4 mm in 36
as statistically significant after assuming all the rules of statistical (54.5%) and thick ≥4 mm in 30 (45.5%). Pericholecystic collection
tests. was seen in 13 (19.7%) subjects, while 14 (21.2%) presented with an
Graphical representation of data: MS Excel and MS word were used to impacted stone (Table 4, Fig. 4).
obtain various types of graphs such as bar diagrams, Pie diagrams, In the study, as per the preoperative score system, 39 (59.1%)
ROC curve, and scatter plots. were predicted to have an easy procedure, 23 (34.8%) were
Statistical software: MS Excel, SPSS version 22 (IBM SPSS Statistics, predicted to have a difficult procedure, and 4 (6.1%) to have a very
Somers NY, USA) was used to analyze data. difficult one (Table 5, Fig. 5).
In the study, 49 (74.2%) subjects were ≤50 years and 17 (25.8%) In the study, 11 (16.7%) had placement of drain (Table 6, Fig. 6).
were >50 years, in which 46 (69.7%) were female and 20 (30.3%) were There is a significant positive correlation between the
male. In total, 13 (19.7%) had previous history of hospitalization for preoperative score and the duration of surgery (p <0.001), and the
cholecystitis, while 53 (80.3%) patients did not (Table 2) (Fig. 2). duration of hospital stay.
World Journal of Laparoscopic Surgery, Volume 15 Issue 2 (May–August 2022) 133