
Page 63 - World Journal of Laparoscopic Surgery
P. 63
Validation of CLOC Score
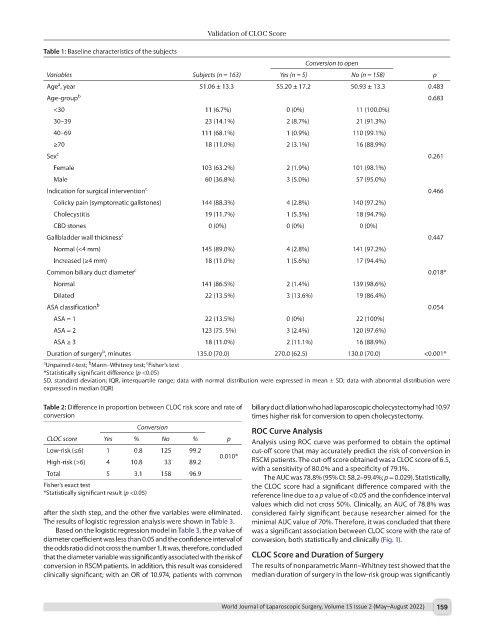
Table 1: Baseline characteristics of the subjects
Conversion to open
Variables Subjects (n = 163) Yes (n = 5) No (n = 158) p
a
Age , year 51.06 ± 13.3 55.20 ± 17.2 50.93 ± 13.3 0.483
Age-group b 0.683
<30 11 (6.7%) 0 (0%) 11 (100.0%)
30–39 23 (14.1%) 2 (8.7%) 21 (91.3%)
40–69 111 (68.1%) 1 (0.9%) 110 (99.1%)
≥70 18 (11.0%) 2 (3.1%) 16 (88.9%)
Sex c 0.261
Female 103 (63.2%) 2 (1.9%) 101 (98.1%)
Male 60 (36.8%) 3 (5.0%) 57 (95.0%)
Indication for surgical intervention c 0.466
Colicky pain (symptomatic gallstones) 144 (88.3%) 4 (2.8%) 140 (97.2%)
Cholecystitis 19 (11.7%) 1 (5.3%) 18 (94.7%)
CBD stones 0 (0%) 0 (0%) 0 (0%)
Gallbladder wall thickness c 0.447
Normal (<4 mm) 145 (89.0%) 4 (2.8%) 141 (97.2%)
Increased (≥4 mm) 18 (11.0%) 1 (5.6%) 17 (94.4%)
Common biliary duct diameter c 0.018*
Normal 141 (86.5%) 2 (1.4%) 139 (98.6%)
Dilated 22 (13.5%) 3 (13.6%) 19 (86.4%)
ASA classification b 0.054
ASA = 1 22 (13.5%) 0 (0%) 22 (100%)
ASA = 2 123 (75. 5%) 3 (2.4%) 120 (97.6%)
ASA ≥ 3 18 (11.0%) 2 (11.1%) 16 (88.9%)
b
Duration of surgery , minutes 135.0 (70.0) 270.0 (62.5) 130.0 (70.0) <0.001*
c
b
a Unpaired t-test; Mann–Whitney test; Fisher’s test
*Statistically significant difference (p <0.05)
SD, standard deviation; IQR, interquartile range; data with normal distribution were expressed in mean ± SD; data with abnormal distribution were
expressed in median (IQR)
Table 2: Difference in proportion between CLOC risk score and rate of biliary duct dilation who had laparoscopic cholecystectomy had 10.97
conversion times higher risk for conversion to open cholecystectomy.
Conversion
ROC Curve Analysis
CLOC score Yes % No % p Analysis using ROC curve was performed to obtain the optimal
Low-risk (≤6) 1 0.8 125 99.2 cut-off score that may accurately predict the risk of conversion in
0.010*
High-risk (>6) 4 10.8 33 89.2 RSCM patients. The cut-off score obtained was a CLOC score of 6.5,
with a sensitivity of 80.0% and a specificity of 79.1%.
Total 5 3.1 158 96.9
The AUC was 78.8% (95% CI: 58.2–99.4%; p = 0.029). Statistically,
Fisher’s exact test the CLOC score had a significant difference compared with the
*Statistically significant result (p <0.05) reference line due to a p value of <0.05 and the confidence interval
values which did not cross 50%. Clinically, an AUC of 78.8% was
after the sixth step, and the other five variables were eliminated. considered fairly significant because researcher aimed for the
The results of logistic regression analysis were shown in Table 3. minimal AUC value of 70%. Therefore, it was concluded that there
Based on the logistic regression model in Table 3, the p value of was a significant association between CLOC score with the rate of
diameter coefficient was less than 0.05 and the confidence interval of conversion, both statistically and clinically (Fig. 1).
the odds ratio did not cross the number 1. It was, therefore, concluded
that the diameter variable was significantly associated with the risk of CLOC Score and Duration of Surgery
conversion in RSCM patients. In addition, this result was considered The results of nonparametric Mann–Whitney test showed that the
clinically significant; with an OR of 10.974, patients with common median duration of surgery in the low-risk group was significantly
World Journal of Laparoscopic Surgery, Volume 15 Issue 2 (May–August 2022) 159