
Page 4 - World Journal of Laparoscopic Surgery
P. 4
Perforated Peptic Ulcer Disease
All ORs were performed using an upper midline incision. temperature, and white cell count (WCC) on presentation. Patients
After identification of the site of the perforation, pyloroplasty with shock at presentation were included only in the OR group.
with radical vagotomy was done. Thorough peritoneal toilet was Operative details for LR and OR groups are presented in
done. Finally, the drain was left. (Table 2).
In LR, the patient was placed in supine position and legs The mean operative time for LR was (151 minutes), significantly
spread with reverse Trendelenburg tilt. The operating surgeon shorter than OR (216 minutes) (p value = 0.0001).
stood between the patient’s thighs. The open method was used The average of nasogastric tube duration was shorter in LR
for insertion of the initial 10 mm umbilical port. A 30° laparoscope group (mean, 3 days vs 4 days) (p value = 0.0001) as well as the
was then introduced. Three additional working ports were inserted average of drainage stay (mean, 2 days vs 3 days) (p value = 0.007),
at the level of the trans-pyloric plane at the midclavicular line on and Foley catheter had been maintained for longer time in the OR
both sides and the third ports in mid-epigastrium. group (3 vs 2 days) (p value = 0.001).
First, we started by peritoneal cavity exploration and searched Analgesic postoperative time was longer for the OR group
meticulously the perforation of pyloroduodenal region. (5 days) than for the LR group (4 days) (p value = 0.001).
Second, we sutured the ulcer perforation using dissolving Postoperative pain was well controlled using oral paracetamol
suture (2.0) with intracorporeal stitch and finally laparoscopic alone in all the patients with LR, whereas two patients in the OR
lavage was done. group required oral tramadol for pain control and one required
All statistical analyses were performed using the statistical intramuscular opioids. In addition, patients who had LR were able
package SPSS version 15.0 for Windows. to return to normal diet and full mobilization significantly earlier if
Categorical variables were described using frequency they had undergone LR. All these factors enabled these patients to
distributions, and continuous variables with descriptive statistics be discharged significantly earlier from the hospital.
were calculated and reported as mean ± SD (if distribution was Morbidity of medical and surgical complication was higher in
normal) or median with range (if distribution was skewed). For open groups (21 vs 2) (p value = 0.0001) (Table 3).
statistical analysis, Student t test was used to compare means of The most common complication in both groups was medical
numerical variables. Pearson chi-square test was used for nominal complication. Overall, 16 patients in the OR group had medical
variables, and Fisher’s exact test was used in instances with low complications such as respiratory, cardiovascular, and postoperative
expected frequencies. A p value < 0.05 was accepted as statistically sepsis vs 2 patients in the laparoscopic group (p value = 0.009).
significant. More cases of pneumonia occurred in OR group compared to
LR group (3 vs 1 case), respectively, but this was not statistically
results significant (p value = 0.64).
From January 2005 to December 2014, a total of 159 patients were
diagnosed with PPU during the study period. Table 1: Comparison of patient demographics and admission
characteristics between laparoscopic and open repair groups
There were 143 (90%) males and 16 (10%) female patients. The
mean patient age was 41 years (range, 19–88 years). Open Laparoscopic p
Fifty-nine (59%) patients were found to have free gas under the Mean age (y) 45 36 0.001
diaphragm on an erect chest X-ray. Sex 0.1
Thirteen (7.6%) of the patients had a known history of PPU. Male 82 61
Twenty-eight (16.4%) patients had a history of non-steroidal Female 12 4
anti-inflammatory drugs (NSAIDs) intake. ASA 69 58 0.6
LR was performed for 65 (41%) patients, and the remaining I 24 7
patients underwent open repair (Flowchart 1).
Among the 94 (59%) patients who underwent direct open II 1 0
surgery, 9 of them had unstable hemodynamic at presentation. III 1 0
There were no conversions in the laparoscopic groups. IV
The demographics and characteristics of the patient’s Temperature (°C) 38 38.5 0.9
9
populations in the LR and OR group are summarized in (Table 1). WCC (×10 ) 16.438 16.620 0.8
There were no significant differences in baseline characteristics ASA, American Society of Anesthesiologists Physical Status Classification
between the groups in terms of gender, American Society of 2014; WCC, white cell count
Anesthesiologists (ASA) physical status score, comorbidities,
Table 2: Preoperative data of the laparoscopic and open patient cohorts
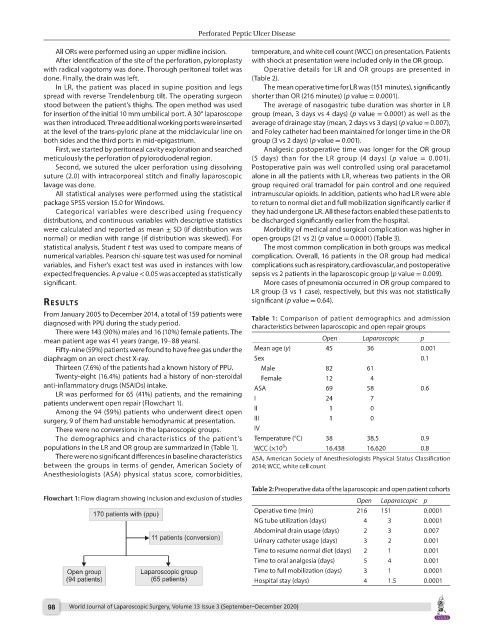
Flowchart 1: Flow diagram showing inclusion and exclusion of studies Open Laparoscopic p
Operative time (min) 216 151 0.0001
NG tube utilization (days) 4 3 0.0001
Abdominal drain usage (days) 2 3 0.007
Urinary catheter usage (days) 3 2 0.001
Time to resume normal diet (days) 2 1 0.001
Time to oral analgesia (days) 5 4 0.001
Time to full mobilization (days) 3 1 0.0001
Hospital stay (days) 4 1.5 0.0001
98 World Journal of Laparoscopic Surgery, Volume 13 Issue 3 (September–December 2020)