Page 22 - Journal of Laparoscopic Surgery - WALS Journal
P. 22

Nuhu Musa Mshelia et al
                                                                          Table 4: Pain perception and χ 2
                                                              Sl. no.  PP observed (O)  PP expected (E)  O−E  χ 2
                                                              1      2              2.55          −0.55  0.12
                                                              2      2              2.55          −0.55  0.12
                                                              3      3              2.55           0.45  0.08
                                                              4      3              2.55           0.45  0.08
                                                              5      3              2.55           0.45  0.08
                                                              6      2              2.55          −0.55  0.12
                                                              7      3              2.55           0.45  0.08
                                                              8      2              2.55          −0.55  0.12
                                                              9      3              2.55           0.45  0.08
                                                              10     2              2.55          −0.55  0.12
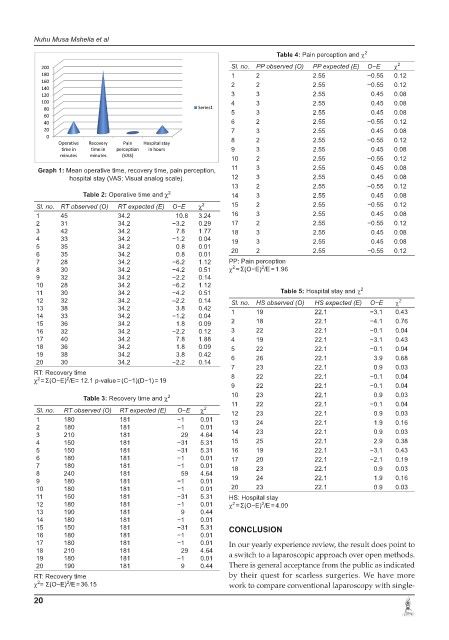
           Graph 1: Mean operative time, recovery time, pain perception,   11  3    2.55           0.45  0.08
                   hospital stay (VAS: Visual analog scale).  12     3              2.55           0.45  0.08
                                                              13     2              2.55          −0.55  0.12
                       Table 2: Operative time and χ 2        14     3              2.55           0.45  0.08
           Sl. no. RT observed (O)  RT expected (E)  O−E  χ 2  15    2              2.55          −0.55  0.12
           1     45             34.2            10.8  3.24    16     3              2.55           0.45  0.08
           2     31             34.2           −3.2   0.29    17     2              2.55          −0.55  0.12
           3     42             34.2            7.8   1.77    18     3              2.55           0.45  0.08
           4     33             34.2           −1.2   0.04    19     3              2.55           0.45  0.08
           5     35             34.2            0.8   0.01
           6     35             34.2            0.8   0.01    20     2              2.55          −0.55  0.12
           7     28             34.2           −6.2   1.12    PP: Pain perception
                                                               2
                                                                      2
           8     30             34.2           −4.2   0.51    χ  = Σ(O−E) /E = 1.96
           9     32             34.2           −2.2   0.14
           10    28             34.2           −6.2   1.12
           11    30             34.2           −4.2   0.51                 Table 5: Hospital stay and χ 2
           12    32             34.2           –2.2   0.14    Sl. no.  HS observed (O)  HS expected (E)  O−E  χ 2
           13    38             34.2            3.8   0.42    1      19             22.1           −3.1   0.43
           14    33             34.2           −1.2   0.04
           15    36             34.2            1.8   0.09    2      18             22.1           −4.1   0.76
           16    32             34.2           −2.2   0.12    3      22             22.1           −0.1   0.04
           17    40             34.2            7.8   1.88    4      19             22.1           −3.1   0.43
           18    36             34.2            1.8   0.09    5      22             22.1           −0.1   0.04
           19    38             34.2            3.8   0.42    6      26             22.1            3.9   0.68
           20    30             34.2           −2.2   0.14
                                                                                                    0.9
          RT: Recovery time                                   7      23             22.1           −0.1   0.03
                                                              8
                                                                                                          0.04
                                                                                    22.1
                                                                     22
          χ  = Σ(O−E) /E= 12.1 p-value = (C−1)(D−1) = 19
           2
                   2
                                                              9      22             22.1           −0.1   0.04
                       Table 3: Recovery time and χ 2         10     23             22.1            0.9   0.03
                                                              11     22             22.1           −0.1   0.04
           Sl. no.  RT observed (O)  RT expected (E)  O−E  χ 2  12   23             22.1            0.9   0.03
           1      180            181            −1    0.01    13     24             22.1            1.9   0.16
           2      180            181            −1    0.01
           3      210            181             29   4.64    14     23             22.1            0.9   0.03
           4      150            181            −31   5.31    15     25             22.1            2.9   0.38
           5      150            181            −31   5.31    16     19             22.1           −3.1   0.43
           6      180            181            −1    0.01    17     20             22.1           −2.1   0.19
           7      180            181            −1    0.01    18     23             22.1            0.9   0.03
           8      240            181             59   4.64
           9      180            181            −1    0.01    19     24             22.1            1.9   0.16
           10     180            181            −1    0.01    20     23             22.1            0.9   0.03
           11     150            181            −31   5.31    HS: Hospital stay
           12     180            181            −1    0.01    χ  = Σ(O−E) /E = 4.00
                                                               2
                                                                      2
           13     190            181             9    0.44
           14     180            181            −1    0.01
           15     150            181            −31   5.31    CONCLUSION
           16     180            181            −1    0.01
           17     180            181            −1    0.01    In our yearly experience review, the result does point to
           18     210            181             29   4.64
           19     180            181            −1    0.01    a switch to a laparoscopic approach over open methods.
           20     190            181             9    0.44    There is general acceptance from the public as indicated
          RT: Recovery time                                   by their quest for scarless surgeries. We have more
                   2
           2
          χ = Σ(O−E) /E = 36.15                               work to compare conventional laparoscopy with single-
          20
   17   18   19   20   21   22   23   24   25   26   27