
Page 5 - World Journal of Laparoscopic Surgery
P. 5
WJOLS
Short- and Long-term Effects of LSG on Body Weight and Glucose Homeostasis in Diabetic Patients
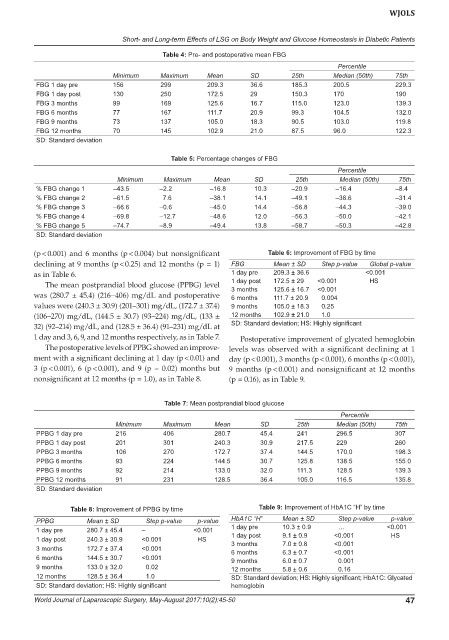
Table 4: Pre- and postoperative mean FBG
Percentile
Minimum Maximum Mean SD 25th Median (50th) 75th
FBG 1 day pre 156 299 209.3 36.6 185.3 200.5 229.3
FBG 1 day post 130 250 172.5 29 150.3 170 190
FBG 3 months 99 169 125.6 16.7 115.0 123.0 139.3
FBG 6 months 77 167 111.7 20.9 99.3 104.5 132.0
FBG 9 months 73 137 105.0 18.3 90.5 103.0 119.8
FBG 12 months 70 145 102.9 21.0 87.5 96.0 122.3
SD: Standard deviation
Table 5: Percentage changes of FBG
Percentile
Minimum Maximum Mean SD 25th Median (50th) 75th
% FBG change 1 –43.5 –2.2 –16.8 10.3 –20.9 –16.4 –8.4
% FBG change 2 –61.5 7.6 –38.1 14.1 –49.1 –38.6 –31.4
% FBG change 3 –66.6 –0.6 –45.0 14.4 –56.8 –44.3 –39.0
% FBG change 4 –69.8 –12.7 –48.6 12.0 –56.3 –50.0 –42.1
% FBG change 5 –74.7 –8.9 –49.4 13.8 –58.7 –50.3 –42.8
SD: Standard deviation
(p < 0.001) and 6 months (p < 0.004) but nonsignificant Table 6: Improvement of FBG by time
declining at 9 months (p < 0.25) and 12 months (p = 1) FBG Mean ± SD Step p-value Global p-value
as in Table 6. 1 day pre 209.3 ± 36.6 <0.001
The mean postprandial blood glucose (PPBG) level 1 day post 172.5 ± 29 <0.001 HS
3 months
125.6 ± 16.7
<0.001
was (280.7 ± 45.4) (216–406) mg/dL and postoperative 6 months 111.7 ± 20.9 0.004
values were (240.3 ± 30.9) (201–301) mg/dL, (172.7 ± 37.4) 9 months 105.0 ± 18.3 0.25
(106–270) mg/dL, (144.5 ± 30.7) (93–224) mg/dL, (133 ± 12 months 102.9 ± 21.0 1.0
32) (92–214) mg/dL, and (128.5 ± 36.4) (91–231) mg/dL at SD: Standard deviation; HS: Highly significant
1 day and 3, 6, 9, and 12 months respectively, as in Table 7. Postoperative improvement of glycated hemoglobin
The postoperative levels of PPBG showed an improve- levels was observed with a significant declining at 1
ment with a significant declining at 1 day (p < 0.01) and day (p < 0.001), 3 months (p < 0.001), 6 months (p < 0.001),
3 (p < 0.001), 6 (p < 0.001), and 9 (p = 0.02) months but 9 months (p < 0.001) and nonsignificant at 12 months
nonsignificant at 12 months (p = 1.0), as in Table 8. (p = 0.16), as in Table 9.
Table 7: Mean postprandial blood glucose
Percentile
Minimum Maximum Mean SD 25th Median (50th) 75th
PPBG 1 day pre 216 406 280.7 45.4 241 296.5 307
PPBG 1 day post 201 301 240.3 30.9 217.5 229 260
PPBG 3 months 106 270 172.7 37.4 144.5 170.0 198.3
PPBG 6 months 93 224 144.5 30.7 125.8 138.5 155.0
PPBG 9 months 92 214 133.0 32.0 111.3 128.5 139.3
PPBG 12 months 91 231 128.5 36.4 105.0 116.5 135.8
SD: Standard deviation
Table 8: Improvement of PPBG by time Table 9: Improvement of HbA1C “H” by time
PPBG Mean ± SD Step p-value p-value HbA1C “H” Mean ± SD Step p-value p-value
1 day pre 280.7 ± 45.4 – <0.001 1 day pre 10.3 ± 0.9 … <0.001
1 day post 240.3 ± 30.9 <0.001 HS 1 day post 9.1 ± 0.9 <0.001 HS
7.0 ± 0.8
<0.001
3 months
3 months 172.7 ± 37.4 <0.001 6 months 6.3 ± 0.7 <0.001
6 months 144.5 ± 30.7 <0.001 9 months 6.0 ± 0.7 0.001
9 months 133.0 ± 32.0 0.02 12 months 5.8 ± 0.6 0.16
12 months 128.5 ± 36.4 1.0 SD: Standard deviation; HS: Highly significant; HbA1C: Glycated
SD: Standard deviation; HS: Highly significant hemoglobin
World Journal of Laparoscopic Surgery, May-August 2017;10(2):45-50 47