
Page 40 - World Journal of Laparoscopic Surgery
P. 40
Preoperative Scoring System to Predict Difficult LC
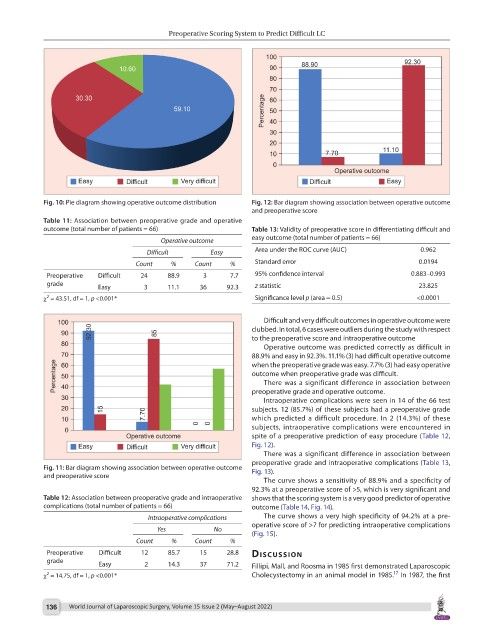
Fig. 10: Pie diagram showing operative outcome distribution Fig. 12: Bar diagram showing association between operative outcome
and preoperative score
Table 11: Association between preoperative grade and operative
outcome (total number of patients = 66) Table 13: Validity of preoperative score in differentiating difficult and
Operative outcome easy outcome (total number of patients = 66)
Difficult Easy Area under the ROC curve (AUC) 0.962
Count % Count % Standard error 0.0194
Preoperative Difficult 24 88.9 3 7.7 95% confidence interval 0.883–0.993
grade Easy 3 11.1 36 92.3 z statistic 23.825
2
χ = 43.51, df = 1, p <0.001* Significance level p (area = 0.5) <0.0001
Difficult and very difficult outcomes in operative outcome were
clubbed. In total, 6 cases were outliers during the study with respect
to the preoperative score and intraoperative outcome
Operative outcome was predicted correctly as difficult in
88.9% and easy in 92.3%. 11.1% (3) had difficult operative outcome
when the preoperative grade was easy. 7.7% (3) had easy operative
outcome when preoperative grade was difficult.
There was a significant difference in association between
preoperative grade and operative outcome.
Intraoperative complications were seen in 14 of the 66 test
subjects. 12 (85.7%) of these subjects had a preoperative grade
which predicted a difficult procedure. In 2 (14.3%) of these
subjects, intraoperative complications were encountered in
spite of a preoperative prediction of easy procedure (Table 12,
Fig. 12).
There was a significant difference in association between
preoperative grade and intraoperative complications (Table 13,
Fig. 11: Bar diagram showing association between operative outcome Fig. 13).
and preoperative score
The curve shows a sensitivity of 88.9% and a specificity of
92.3% at a preoperative score of >5, which is very significant and
Table 12: Association between preoperative grade and intraoperative shows that the scoring system is a very good predictor of operative
complications (total number of patients = 66) outcome (Table 14, Fig. 14).
Intraoperative complications The curve shows a very high specificity of 94.2% at a pre-
operative score of >7 for predicting intraoperative complications
Yes No
(Fig. 15).
Count % Count %
Preoperative Difficult 12 85.7 15 28.8 dIscussIon
grade Easy 2 14.3 37 71.2 Fillipi, Mall, and Roosma in 1985 first demonstrated Laparoscopic
17
2
χ = 14.75, df = 1, p <0.001* Cholecystectomy in an animal model in 1985. In 1987, the first
136 World Journal of Laparoscopic Surgery, Volume 15 Issue 2 (May–August 2022)